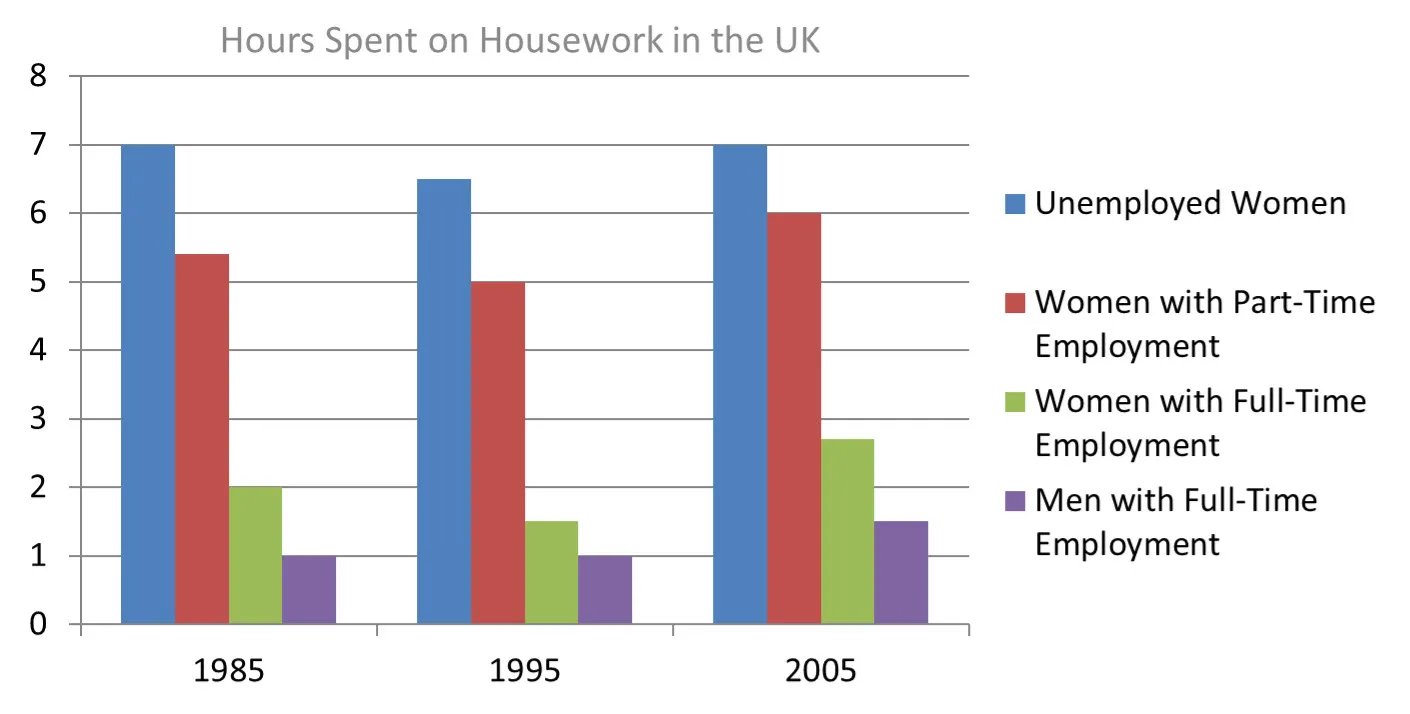
The bar chart below shows the average duration of housework women did (unemployed, part-time employed, and full-time) when compared to men who had full-time work in the UK between 1985 and 2005. Summarise the information by selecting and reporting the main features, and make comparisons where relevant.
The bar chart describes the comparison of the average amount of housework hours spent between women who are unemployed, women working part-time, women working full time, and men who did full-time jobs in the UK from 1985 to 2005.
Overall, women who had part-time and full-time jobs and men who worked full-time jobs spent more hours on doing housework over the periods, while the number of hours spent of unemployed women ended up staying the same in 2005.
It can be clearly seen women who were jobless spent time doing housework more than others, 7 hours and it stayed stable at the end of the year 2005 after it had a little drop to 6.5 hours during 1995. Women worked part-time and full time, did housework about 5.5 hours and 2 hours respectively, while those numbers dropped by half an hour in 1985. In 2005, those numbers increased slightly to 6 hours and roughly 3 hours.
Men who had full-time jobs spent less time doing housework compared to women who worked full time. Although there was an increase in the number of hours that men spent doing housework from 1985 to 2005, approximately 3 hours, between 1985 and 1995, men worked full time spent only an hour on housework.
Follow Us on IELTSDATA Twitter
Also read: The Chart below Shows the Top Ten Countries with the Highest Spending

