The bar chart below shows the numbers of men and women attending various evening courses at an adult education centre in the year 2009. The pie chart gives information about the ages of these course participants. Summarize the information by selecting and reporting the main features, and make comparisons where relevant.
The map illustrates the number of men and women that participated in various evening courses at the adult education centre in 2009. At the same time, the pie chart demonstrates the distinct age of these course participants.
Overall, the number of people that attended evening courses at the adult education centre was a mixture of both genders, from which female denoted the highest which male was the lowest in exception of one subject. This was rated in a number of people in 2009. At the same time, the age range of participants at the various course had its peak at age 50 and above and a hit low at age under 20.
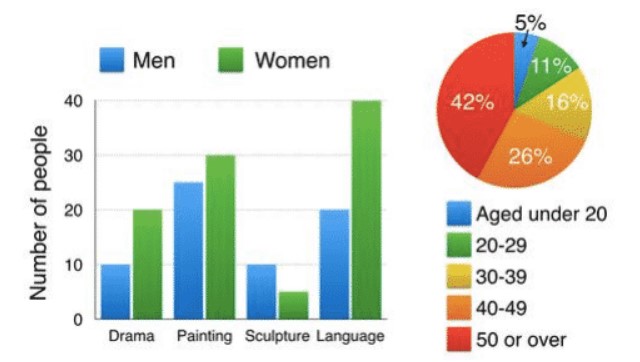
From the bar chart, which represented the number of men and women that took part in the evening courses, women recorded the highest participants across all subjects apart from the sculpture—ranging as 40 number of people in a language which was the peak across all courses, 30 in painting, 20 in drama and about 5 in sculpture which was the lowest of female participants of all the subjects. This was measured in the number of people. At the same time, the men had their peaked attendance in the painting of about 25 people, 20 in language and a significant record of 10 persons in drama and sculpture, which was their trough.
Moreover, the age range of participants was represented in the pie chart, age 50 and above had a peaked of 42%, followed by people within the age of 40-49, which was 26%, age 30-39 recorded 16%, age 20-29 had 11%, and people of under 20 of age had a hit low of 5%as seen in the chart.
Follow Us on IELTSDATA Twitter
Also read: The Table Beneath Shows the Level of People Specialists in Various Kinds