The Bar Chart Shows the Typical Weekday for Students in Three Different Countries. Summarize the Information by Selecting and Reporting the Main Features, and Make Comparisons Where Relevant.
 Sample Answer: The Bar Chart Shows the Typical Weekday for Students in Three Different Countries.
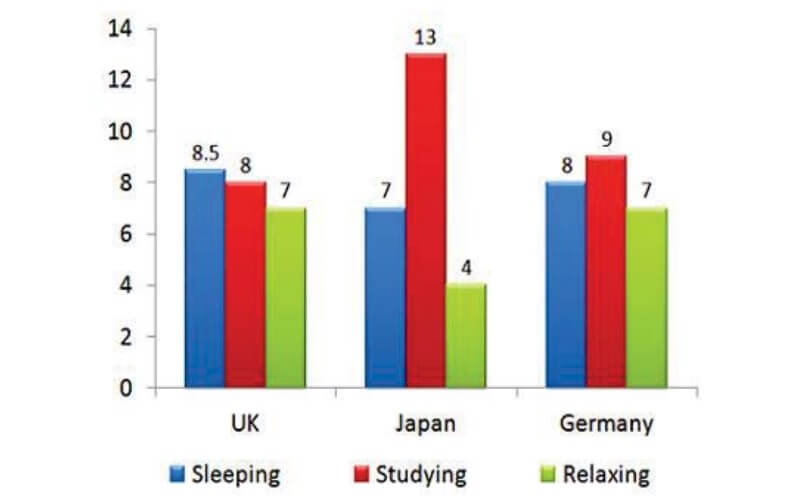
The bar chart illustrates the typical weekday for learners in three different countries: The UK, Japan, and Germany.
Overall, the three types of categories are sleeping, studying, and relaxing. In Japan, there is the highest population of studying on weekdays for students, while the UK and Germany remain the same for studying.
To begin with, in the UK, 8.5% of sleeping the typical weekday, but 8% and 7% for learners to give up. However, Japan has the highest population of studying. It is 13% studying, 7% sleeping, and 4% relaxing. In order, it can be clearly seen that Japanese students are not west of time.
Furthermore, in Germany, students get 8% sleep and 9% study on a typical weekday. The UK and German students are all the same population, so give up. Lastly, German students are at 7% relaxing on weekdays.
Follow Us On IELTSData Facebook Page For More updates