The Bar Charts Below Show the Marriage and Divorce Statistics for Eight Countries in 1981 and 1994. Write a Short Report for A University Lecturer Describing the Information Shown Below.
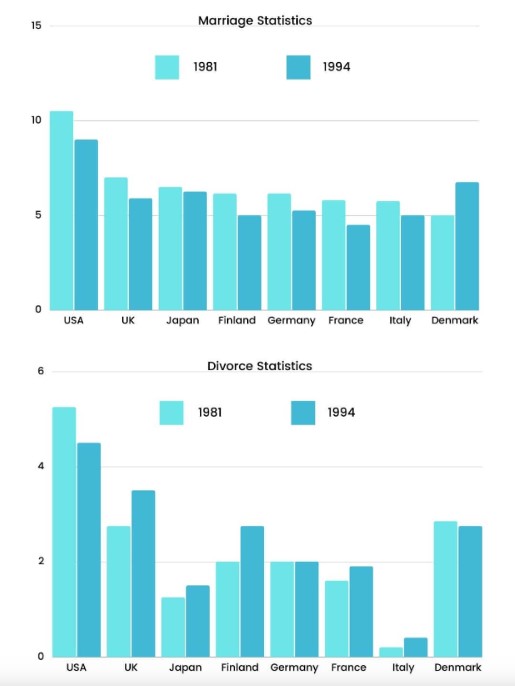 📊 The bar charts below show the Marriage and Divorce Statistics for eight countries in 1981 and 1994. The data provide information on how many people were together and separated in their marital life in different countries within the two-time frames, 1981 and 1994.
📉 Overall, the data show that the proportion of divorces was modestly fewer than marriages in all the countries between 1981 and 1994. In 1981, the marriage rate of all the countries was slightly higher than in 1994, except in Denmark. Unlike the marriage rate, the divorce rate was not stable and fluctuated over thirteen years.
🇺🇸🇬🇧 The ratio of marriage to divorce among Americans and Britons was nearly half in the given two periods. Remarkably, Italy showed a significant difference in the ratio of marriage and divorce, which was negligible. However, European countries also had a lower rate of divorce compared to the number of marriages in both 1981 and 1994.
Follow Us on the IELTSData Facebook Page For More Updates