


The bar graph shows the global sales (in billions of dollars) of different types of digital games between 2000 and 2006. Summarise the information by selecting and reporting the main features, and make comparisons where relevant.
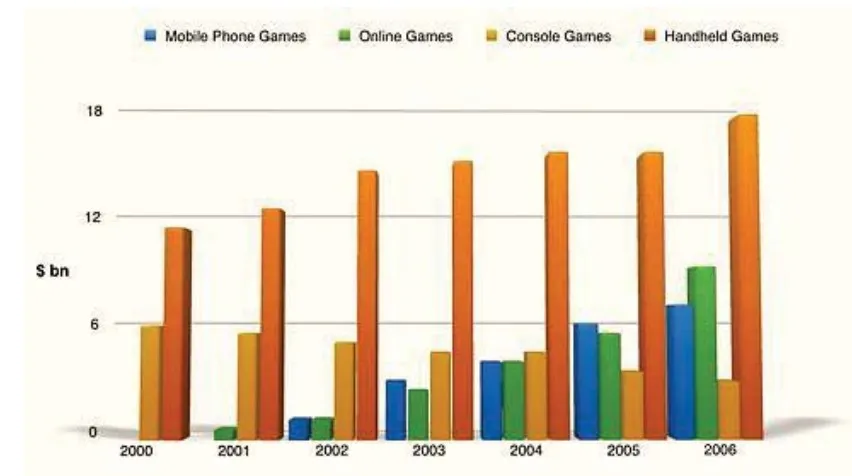

The bar graph illustrates the world’s comprehensive sales of four digital games, namely mobile phone games, online games, console games and Handheld games, from 2000 to 2006.
Overall, a glance at the graph is enough to clarify that Handheld, online, and mobile games show a rising trend in the given frame. At the same time, console games show a decline in the same period.
To begin with, At the beginning time of the period, the highest number of games sold was handheld games, which was nearly 11 billion dollars. Moreover, In 2006 these games sold at an all-time high and sold 6 billion dollars more elevated compared to 2000. Online games sales started in 2001 with only 1 billion dollars, mobile phone games started in 2001 with only 1 billion dollars, and mobile phone games started their sale in 2002. It accounted for 2 billion dollars. In 2004, mobile phone and online game sales were the same, which was 4 billion dollars for each.
However, In 2000 second highest sales were console games worldwide, but after that, this type of game lost its popularity, and this game showed a decline trend year by year. Moreover, this type of game faced the all-time lowest sale in 2006, which was only half of their beginning sale.
Follow Us on IELTSDATA Twitter