
The Chart Below Shows the Average Daily Minimum and Maximum Levels of Two Air Pollutants in Four Big Cities in 2000. Summarise the Information by Selecting and Reporting the Main Features and Making Comparisons Where Relevant.
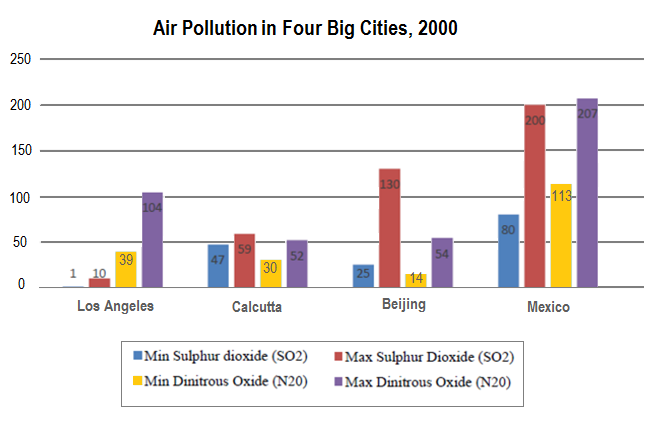 The given chart 📊represents the average daily minimum and maximum levels of two air pollutants in four big cities: Los Angeles, Calcutta, Beijing, and Mexico City in the year 2000.
Overall, the given chart shows numerous fluctuations, but except for Mexico City, Sulphur dioxide and nitrous oxide were at their highest levels.
Also, Read The Pie Charts Below Show the Online Shopping Sales for Retail Sectors
Having a fleeting glance, in Los Angeles, the nitrous oxide was highest at 104, and the minimum sulfur dioxide was at 39. A sudden change was observed in the maximum sulfur dioxide. In Calcutta, minimum and maximum sulfur dioxide were both noticed at 47 and 59, respectively, whereas the maximum nitrous oxide was the lowest at 32.
Moving further, in Beijing, the maximum sulfur dioxide was highest at 130, whereas the maximum nitrous oxide was observed at 54. A sudden change was noticed for both minimum sulfur dioxide and minimum nitrous oxide at 25 and 14, respectively.
Follow Us on the IELTSData Facebook Page For More Update
In Mexico City, the minimum sulfur dioxide and maximum nitrous oxide remained constant at 200 and 207. A dramatic decrease was observed in minimum sulfur dioxide, which was at 80, while minimum nitrous oxide was at 113.