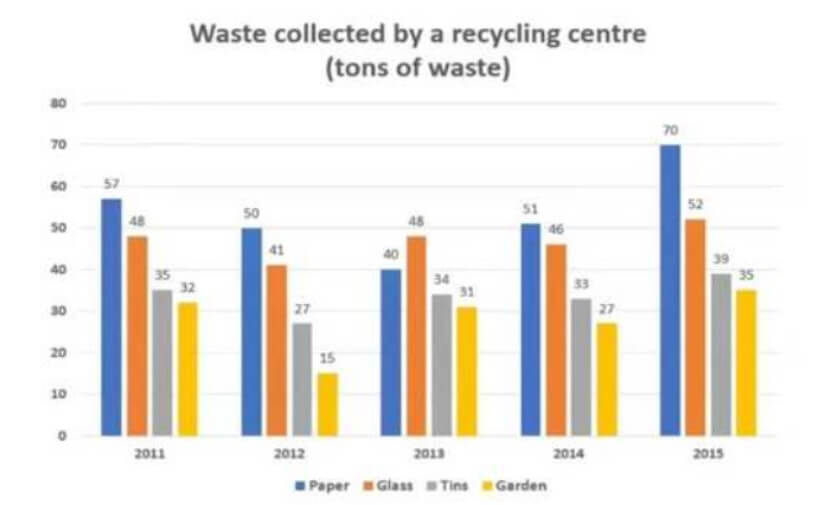
The Chart Below Shows Waste Collection by A Recycling Center from 2011 to 2015. Summarise the Information by Selecting and Reporting the Main Features and Making Comparisons Where Relevant.
 Sample Answer: The Chart Below Shows Waste Collection by A Recycling
The given bar chart delineates the information about how much waste the recycling centre stored between 2011 and 2015. This data has been calibrated in tons.
Overall, paper waste was collected more than other waste except in 2013. Another interesting point is that fluctuation trends could be seen in all types of waste material.
In 2011, paper was the highest reprocessed waste, followed by glass, tons, and garden; their figures were 57, 48, 35, and 32 tons, respectively. In the next year, the paper was approximately double that of tins, whereas the least was a garden with 15 tons. A minute difference of 3 tons was observed between tins and gardens in 2013, while glass had the highest number of tons recycled.
Further information shows a decreasing trend in 2014, in which paper was the highest and the garden collected the least waste. Although the number of glass waste recycled increased, it remained less than that of paper, which accounted for 70 tons. Four tons more tin waste was collected for recycling than the garden (35 tons).
Follow Us On IELTSFever Facebook Page For More Updates
