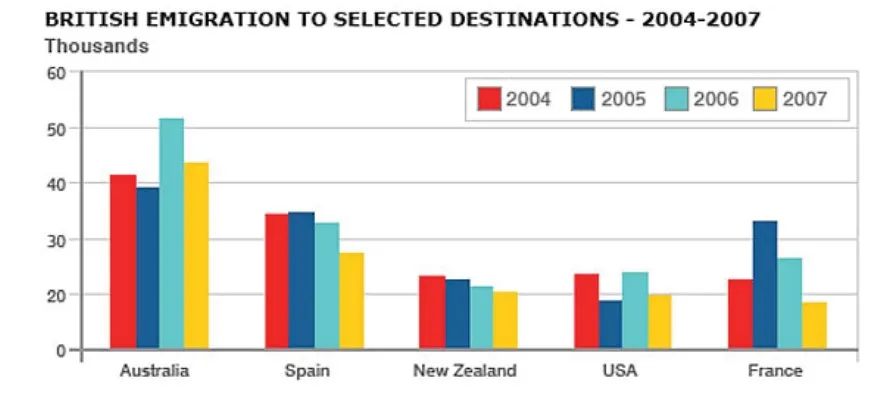
The chart shows British Emigration to selected destinations between 2004 and 2007.
The bar chart illustrates the number of Britishers who immigrated to Australia, Spain, New Zealand, the USA, and France in 4 years from 2004 to 2007. From an overall perspective, it is readily apparent that a maximum number of British people immigrated to Australia while Fluctuation was observed in every country. However, most minor immigrants were in the USA, except in Spain and New Zealand.
British immigrants showed fluctuation in Australia, the USA, and France. Britishers who moved to Australia accounted for nearly 40,000 in 2004 which slightly decreased in the next year and reached its peak in 2006 with almost 50,000 Immigrants again declined to almost 43,000 in the final year but still maintained the highest peak. Similarly, the USA and France showed almost the same numbers of immigrants in the 1st year with above 20,000 but in the USA.
Immigrants declined to around 18,000 whereas in France, they promptly inclined to above 30,000 and then decreased significantly to below 20,000 in 2007 while in the USA immigrants fluctuated and in 2007 accounted for precisely 20,000. Spain and New Zealand followed a downward trend, In Spain, British immigrants were around 34,000, which increased a little the next year and then declined to below 30,000 in 2007 while the Britishers did.
Moved in New Zealand was almost 23,000 in 2004 and then steadily decreased to around 20,000 in 2007.
Follow us on Ieltsdata/Twitter

