The Chart Shows the Components of Gdp in The Uk from 1992 to 2000. Summarize the Information by Selecting and Reporting the Main Features and Making Comparisons Where Relevant.
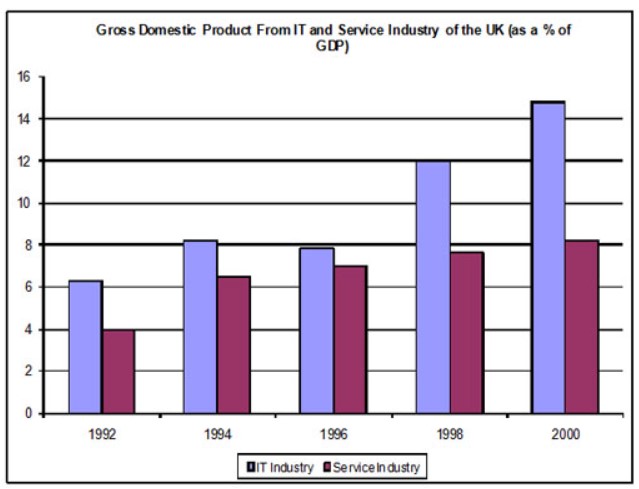
The bar chart given depicts data about the components of the Gross Domestic Product for the Information Technology industry and Service industry in the United Kingdom between the years 1992 to 2000.
Overall, it is seen from the graph that as the year goes by, the Service industry increases yearly without a drop in any of the years. In contrast, the IT industry increases steadily in two years, drops in the middle year, and increases rapidly in the fourth and fifth years. However, the IT industry is the highest in each of the years.
While that of the Service industry’s a steady increase in each year and there was never a drop in any year compared to the IT industry that has a reduction in the third year, furthermore in the Service industry in all the years, non was higher than 8, maximum for Service industry was 8, which was in the last year, finally in the middle year, IT industry and Service industry is almost the same, within the range of above 6.
Analysis from the chart shows the following are observed, firstly in the year 1992 the IT industry was above six while the Service industry was just 4, secondly in 1994, the IT industry was 8, while the Service industry was above 6, thirdly in 1996, there was a drop in IT industry compared to the previous IT industry year, despite the fall, the IT industry was still higher than the Service industry.
Furthermore, in 1998, the IT industry was 12, far higher than the Service industry, finally, in 2000 the IT industry was significantly higher within a range above 14 while the Service industry was just eight, which is the maximum in all the years in the Service industry.
Follow Us on IELTSDATA Twitter

