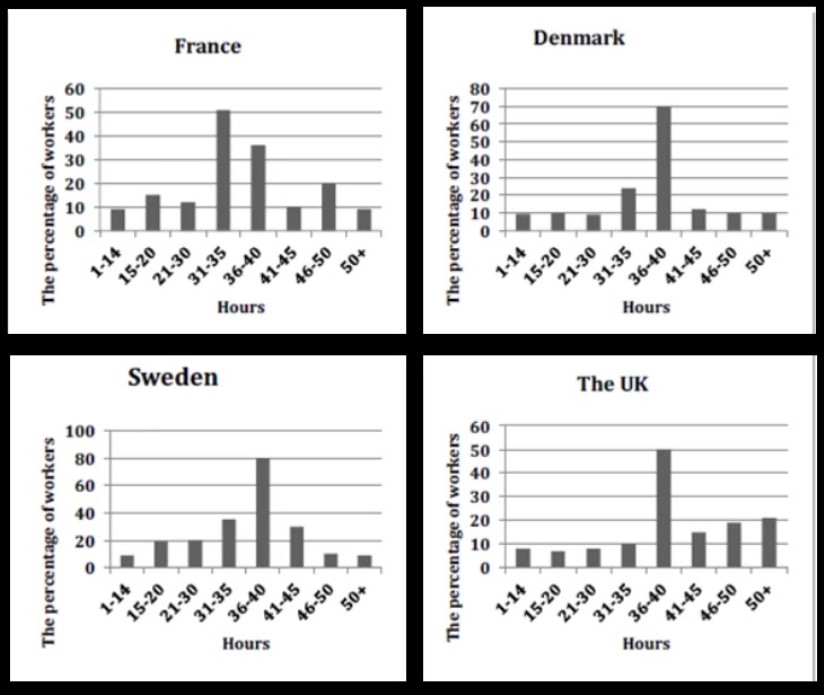
The Charts below Show the Figure for Hours of Work per Week in the Industrial Sector in four European countries in 2002. Summarise the information by selecting and reporting the main characteristics, and compare with the corresponding ones.
Sample Answer of The Charts below Show the Figure for Hours of Work per Week in the Industrial Sector
The charts predicted the compare and contrast In difference the number of hours of job per week in the factory sections in France, Denmark, Sweden and the UK in 2002.
In an overview in Sweden, the percentage of workers was the maximum whilst similar ratio in France and the UK.
Initially, the ratio of employees who work 14 hours in France and Denmark was 10%; However, the percentage of people slightly inclined and reached 15% in France. Whilst as the figure was similar in Denmark to work for 21 – 30 hours. 50% of employees work in trade for 31 – 35 hours in France, whereas it was half of Denmark. in Denmark labourer works 36 – 40 hours was 70%, which is half of France .moreover, percentile of employees in France and Denmark was similar 10 in 50 hours. Interestingly, it was 20% in 46- 50 hours in France.
Probing ahead, the workers work 36 – 40 hours in Sweden was 80% which is 30% less than in the UK .the ratio was less than 10% of 1-14, 46-50 and 50 + hours in Sweden. However, 31- 45 hours was approximately 35% workers in the UK . the figure of employees below than 10% who works 35 hours. However, 20% whose who work 50 hours.
Follow Us on IELTSDATA Twitter
Also, Read The chart below shows the places visited by different people living in Canada.

