The Graph Below Gives Information About Dubai Gold Sales in 2002. Summarise the Information by Selecting and Reporting the Main Features, and Make Comparisons Where Relevant.
Sample 1: The Graph Below Gives Information About Dubai Gold Sales in 2002
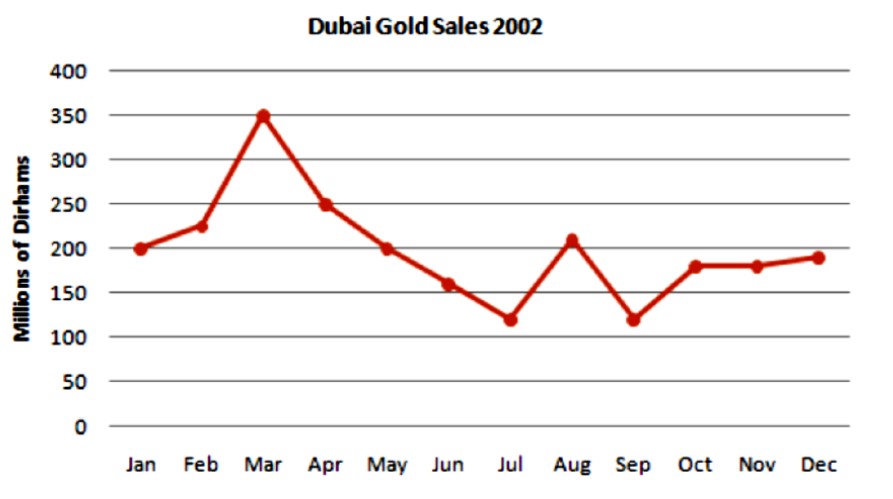
The given line graph illustrates the details of the information about the monthly sale of gold in Dubai City in the year 2002. Gold sales are calculated in Millions of dirhams from January to December.
At a cursory glance, it can be noticed that the business of gold reached its peak in March and afterwards experienced a fluctuating nature. In detail, the buying of gold showed an upward trend from January. And in March, it reached its maximum sale of 350 million dirhams.
Then from April to July, the sales showed a sharp fall from 350 to around 100 million dirhams. Between July and September, gold sales again showed an increase of a hundred million dirhams in August.
Moving on, from October, the trading of gold followed a slight increase and reached 200 million dirhams at the end of the year.
Sample 2: The Graph Below Gives Information About Dubai Gold Sales in 2002
The graph provides data about the amount of gold sold in Dubai in 2002, presented in millions of dirhams. Overall, it is noticeable that there was a fluctuation in gold sales throughout the given timeframe.
To begin, in January, the amount of gold that was sold stood at 20 million dirhams. While there was an increase in the number of gold sales, reaching 350 million dirhams in March; Moreover, over the next three consecutive months (April, May, and June), the sales of gold witnessed a decrease reaching 120 million dirhams in July.
Furthermore, there was a fluctuation in the number of gold sales between August and September. It reached a peak of 200 million dirhams in August, and then it declined to 120 million dirhams in September. Where it increased slightly, finishing at about 200 million dirhams it began with.

