The graph below shows the average monthly change in the prices of three metals during 2014. Summarise the information by selecting and reporting the main features and make comparisons where relevant.
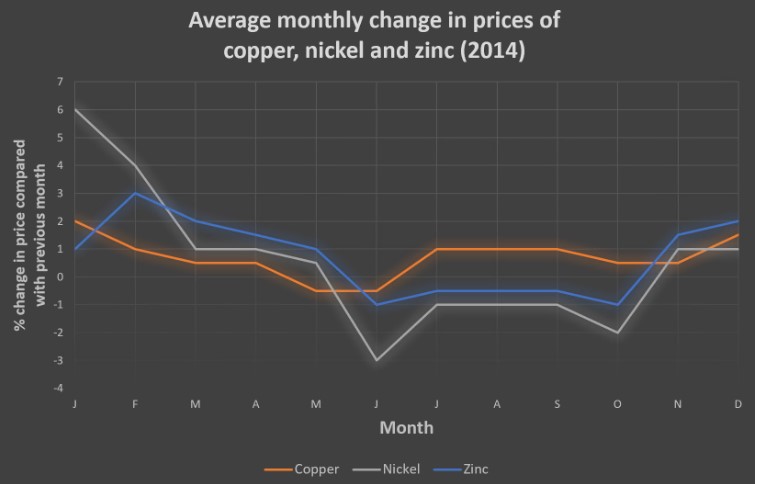
The line graph reveals the costs of 3 different metals that changed after every month during 2014. The scale for it is in percentage.
To commence with, in the month of January, the change in the price of zinc was 1 per cent more than the previous month, which rose by two per cent after a month. After a minor fluctuation from March to November, it reached more than 1.5 per cent, which went slightly upward in December.
Moreover, the change in the amount of money to buy copper accounted for 2 per cent, which was the same as for zinc in the last month. From January to June, it continued to decrease to below 0 per cent.
Furthermore, the price of copper increased by one per cent in July, and remained constant till the next two months, when it again decreased and moved upward after November. In contrast, there was a significant difference between the value of copper and Nickel for the initial 2 months.
In March, the price for Nickel was changed from 6 to 1% which sharply decreased to minus 3% in June. Then it was increased by 2% in the next month, which fluctuated and created a one percentage change in November.
Follow Us on The IELTSData Facebook for more updates