


The graph below shows the contribution of three sectors- agriculture, manufacturing, and business and financial services- to the Uk economy in the twentieth century. Summarize the information by selecting and reporting the main features, and make comparisons where relevant.
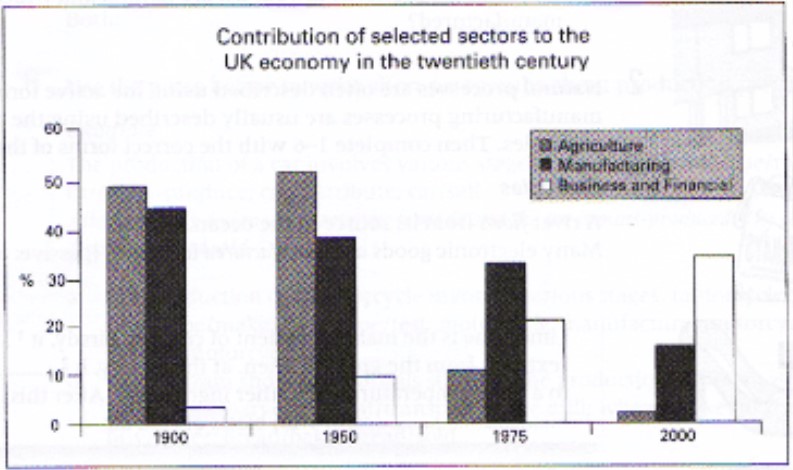

The bar graph illustrates the percentage of three sectors that contributed to the UK economy.
At first glance, it is manifested that in 1900, the agriculture sector contributed to the UK economy was just below 50%. The contribution accounted for the agriculture sector as opposed to only three per cent for manufacturing, while the business and finance sectors participation was only two per cent to the Uk economy. By1950, the contribution had experienced agriculture sector was five times that of the year 1975.
Moving further, the proportion of business and finance sectors regularly inclined from the year 1900 to 2000; however, with regards of manufacturing opposite trend was seen as compared to business and finance sector.
Overall, it is clearly seen that the agriculture sector was highly contributed to Uk economy and least contribution was seen in case of business and finance sector.
Follow Us on IELTSDATA Twitter
Also read: The Chart Below Shows the Percentage of Young People in Higher Education