
The Graph Below Shows Waste Recycling Rates in The U.S. from 1960 to 2011. Summarise the Information by Selecting and Reporting the Main Features and Making Comparisons Where Relevant.
 Sample Answer: The Graph Below Shows Waste Recycling Rates in The U.S.
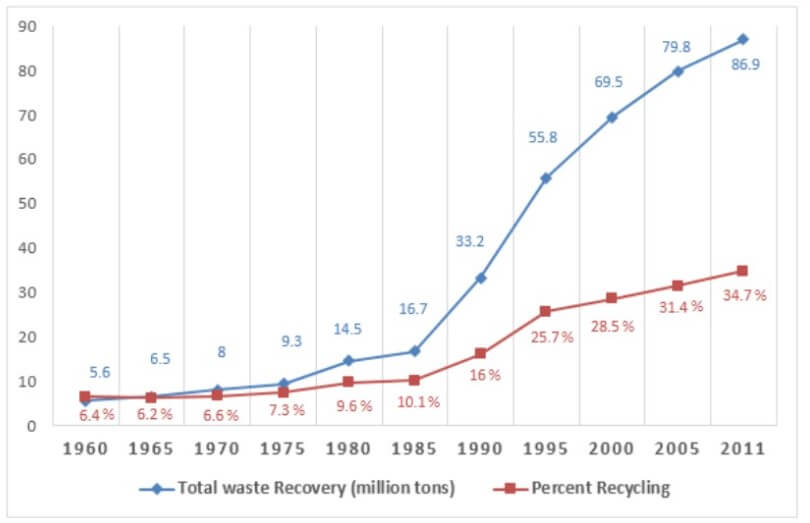
The line graph expounds information regarding the recovery of total wastage and the proportion of recycling in a particular nation, the United States, between 1960 and 2011.
From an overall analysis, it can be seen that the total amount of waste and the percentage of recycling followed an upward trend.
It is evident from the graph that general similarities (almost 6%) can be seen in the proportion of recycling between the period of 1960 and 1970. In the following year (1975), the percentage of recycled waste slightly increased and reached 7.3%. In the subsequent years, the proportion of recycling of wastage increased moderately. The rate of wastage recycled in the U.S. was 16%, 25.7%, and 28.5% in 1970, 1995, and 2000, respectively. In the final year (2011), 34.7% of recycling was recorded.
Moving towards the rest of the information, in 1960, 5.6 million tons of total wastage increased by 2.4 million tons and reached 8 million tons. The next year, it followed the upward trend again and accounted for 9.3 million tons. The total waste recovered in the U.S. was 14.5, 16.7, and 33.2 million tons in 1980, 1985, and 1990, respectively. The count of total waste recovery almost reached a pinnacle point (86.9 million tons) in the last year (2011).
Follow Us On IELTSData Facebook Page For More Updates