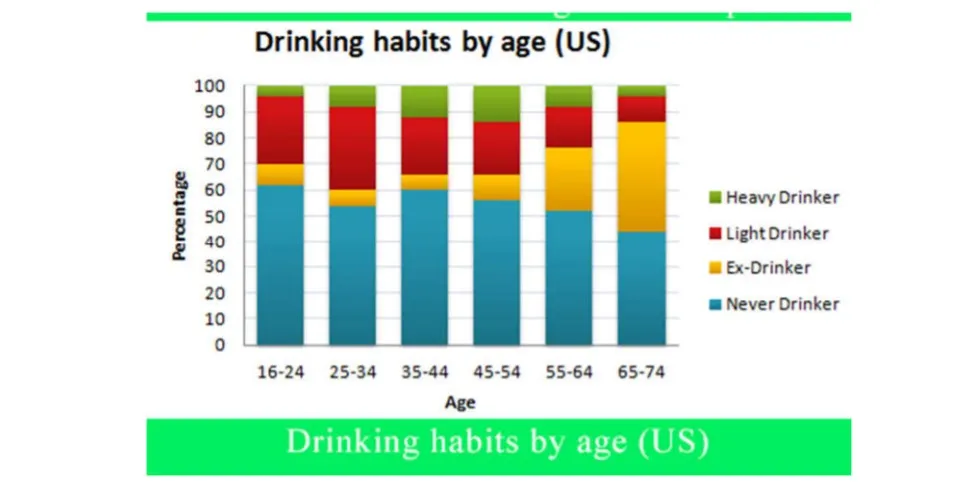
The graph gives information about the drinking habits of the US population by age. Summarise the information by selecting and reporting the main features, and make comparisons where relevant.
 Sample answer of The Graph Gives Information About the Drinking Habits of the Us Population by Age
The graph illustrates the drinking habits in the percentage of the US population by age from 16 years to 74 age. This drinking habit is also categorised into four different types such as heavy drinker, light drinker, ex-drinker, and never a drinker.
From the graph, it is clearly visible that the nature of heavy drinkers over age is parabolic. The habit of drinking increases till 45-54 age, and afterwards, it is decreasing. The never drinker habit remains almost the same in the 16-24 and 35-44 age group.
The habit of light drinkers is decreasing with the increase of age while the habit of ex-drinker is completely reverse than the light drinker. For all age groups, never drinker habit is almost the highest. Except for the 65-74 age group, in this age group, never drinker and ex-drinker cover the same value. Except for the old age group 65-74, in every group never drinker persons are more than half.
Follow Us on IELTSDATA Twitter
