
The Graph Shows Information on Smoking Frequently Seen Among Athletes of Parkview Secondary School. Summarize the Information by Selecting and Reporting the Main Features and Making Comparisons Where Relevant. You Should Write at Least 150 Words.
 📊 The pie charts illustrate the percentage of smoking frequency among athletes at Parkview Secondary School. Overall, they show the statistics of smokers and non-smokers among boys and girls.
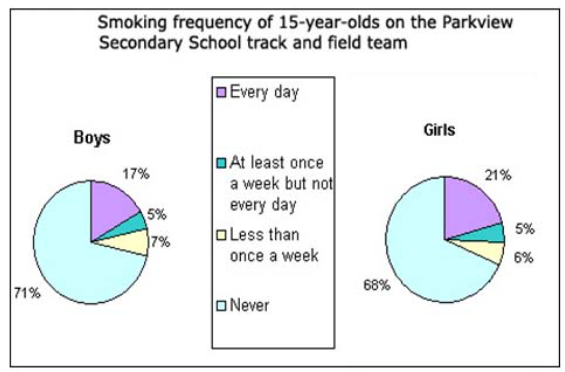
👟 At Parkview Secondary School, both the track and field teams’ smoking frequency varies from daily smokers to non-smokers among 15-year-old teenagers. According to this report, girls are smoking more than boys, even daily.
Apart from everyday smokers, athletes who smoke once a week or less were more or less similar for both boys and girls.
🚭 Moreover, girls were smoking more every day than boys. It seems that non-smokers make up three-fourths of 15-year-old athletes, whereas smokers range from 29-42 per cent.
Follow Us on the IELTSData Facebook Page For More Updates