The graphs below show the numbers of male and female workers in 1975 and 1995 in several employment sectors of the republic of Freedonia. Write a report for a university teacher describing the information shown.
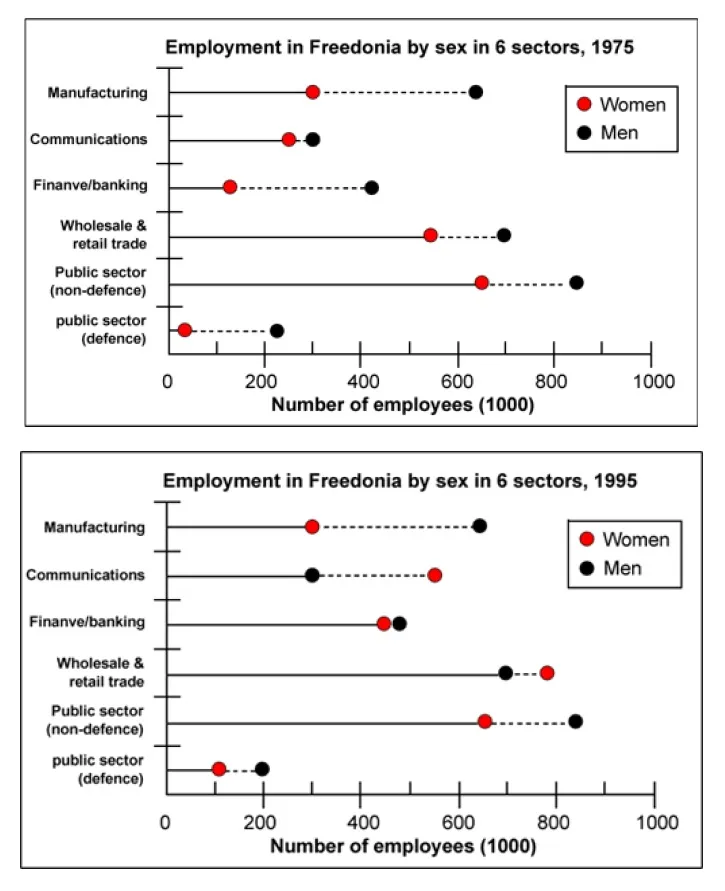
The graphs illustrate the number of employment in Freedonia by sex in six sectors between 1975 and 1995.
Overall, at the beginning of the time, both genders had the highest employment in the non-defence public sector while the defence had the least employment for both s@xes. Moreover, after two decades, more female workers in communications, wholesale and retail trade sectors compared to male.
To commence with, in 1975 more than 600 men worked in manufacturing sectors while half of that females worked in the same sectors. Moreover, in the communication sector, almost the same number of women and men worked, which was around 300 each of them. In the banking and finance sectors worked the number of men and females was 110 and 410 respectively. More men work in wholesale and retail trade compared to women. In addition, In 1975, the highest number of females worked in the non-defence public sector, while in the defence sector, only a few women worked.
Moreover, after 20 years, in terms of number, the female had the lead in communications and wholesale and retail trade sectors over men. Manufacturing had the same employment as compared to 1975. Apart from this, an equal number of females and males worked in the banking and finance sector. The defence sector reduces male employment while increasing female employment. At the same time, the non-defence sector has the same employment as in 1975.
Follow Us on IELTSDATA Twitter
