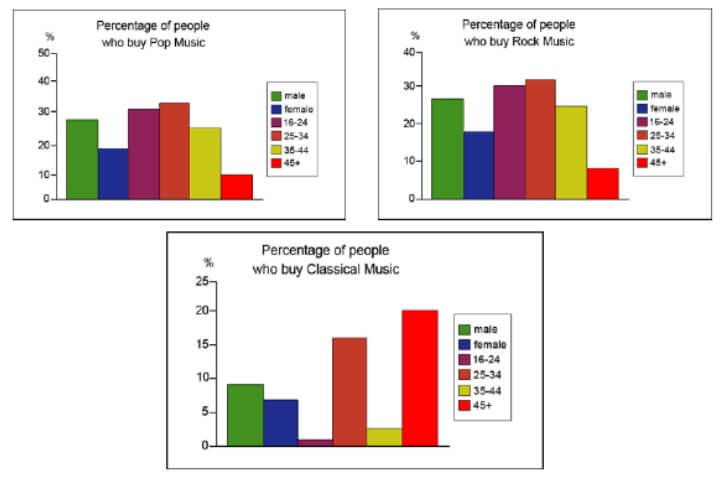
The Graphs Below Show the Types of Music Albums Purchased by People in Britain According to S@x and Age. Write a Report for A University Lecturer Describing the Information Shown Below.
The following bar graphs illustrate the type of music albums bought by people in Britain based on their gender and age categories. The graphs compare three kinds of music albums which are pop music, rock music and classical music.
Overall, pop music and rock music accounted for larger numbers of listeners, while fewer buyers were choosing classical music for both two genders. The proportion of males who consumed music albums was higher than the female ratio in all categories.
Also, Read The Diagram Below Shows the Process of Using Water to Produce Electricity
In terms of pop and rock music, people between the ages of 25 and 34 were the major audience, accounting for around 30% and 35% of total consumers, respectively. Surprisingly, the rate of elderly people was the lowest, at below 10%.
Old people who are more than 45 years old were the highest audience who purchased classical music genres. The ratio was around 22%, whereas the proportion for the age group of 25 to 34 was lower at about 15%. The other audience groups, which were young people and middle-aged people, made up the smallest percentage of buyers at only 3% and 1%, respectively.
Follow Us On IELTSFever Facebook Page For More Updates

Pingback: Some People Think that Governments Should Give Financial Support to Creative - IELTS DATA