


The Line Graph Below Shows Changes in The Amount and Type of Fast Food Consumed by Australian Teenagers from 1975 to 2000.

This line graph depicts the trends of fast food consumption by teenagers in Australia over 25 years period from 1975 to 2000. The charts show how trends have changed over time with changes in the types of fast food consumed.
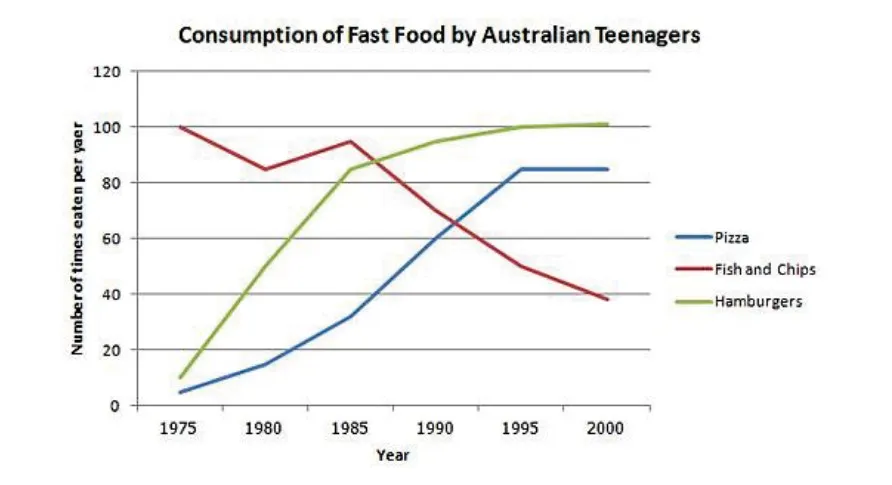
In general, pizza and hamburgers consumption has increased over time, whereas consumption of fish and chips has decreased dramatically over the years.
In 1975, Australian teenagers ate fish and chips 100 times per year compared to low consumption of pizza and hamburgers within the same year, around ten times per year. However, fish and chips consumption fluctuated from 1980 to 1985, and it reported a marked downward trend towards 2000 when it is written as 40 times per year.
In contrast, pizza and hamburgers reported an uprising trend over 25 years. Hamburgers consumption from 1975 to 1985 showed a steady increase up to 85 times per year, at last, then it became stagnant from 1995 to 2000, reporting 100 times consumption per year. Pizza consumption has also shown a similar trend to hamburgers, where its consumption reached a plateau from 1995 to 2000, reaching around 85 times consumption per year.
In conclusion, Australian teenagers have reduced the consumption of fish and chips over 25 years, and they have increased their pizza and hamburgers consumption instead of that.
Follow Us on IELTSDATA Twitter