
The Line Graph Below Shows the Number of Annual Visits to Australia by Overseas Residents. The table Below Gives Information on The Country of Origin Where the Visitors Came From. Write a Report for A University Lecturer Describing the Information Given. The Line Graph Below Shows the Number of Annual Visits to Australia
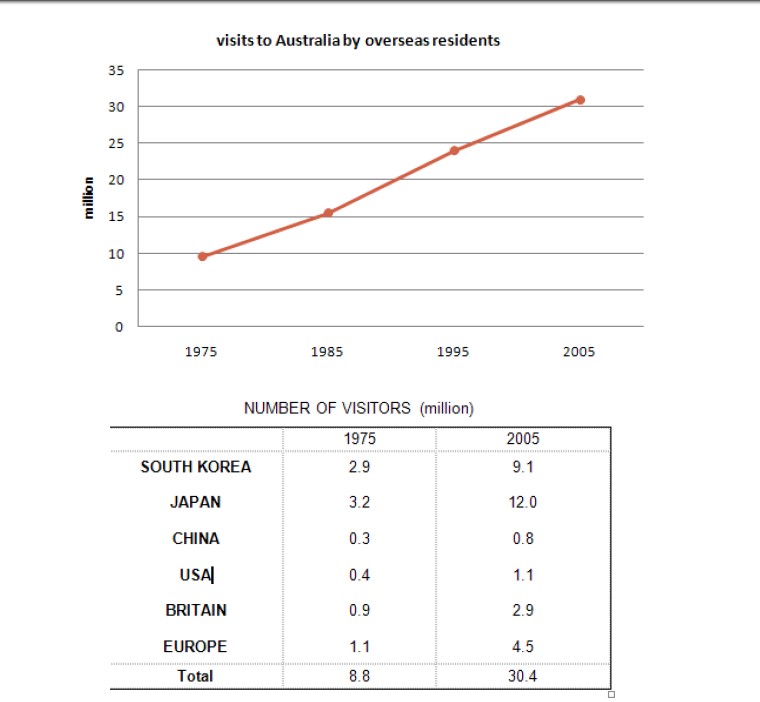
The line graph provides information about the number of international people that visit Australia, while the table gives data about the national origin of the visitors. The unit of measurement is in Millions.
Overall, 2005 saw a dramatic increase in the number of people living abroad who visited Australia, with the majority of people coming from Japan, while 1975 saw a significant decrease in the number of overseas visitors, with a minority of people coming from China.
To begin, 2005 saw a significant increase in the number of overseas people who visited Australia annually, it was about 30 million, which is the highest. This is followed by a slight increase in the year 1995, which accounted for about 24 million. Meanwhile, the number of overseas people decreased in 1985; it was 15 million, followed by 1975, which had the lowest number of international people who visited Australia, which was less than 10 million.
Follow Us on IELTSData Facebook Page For More Updates
However, The country of origin of people who visited Australia in 2005 increased. Japan has the highest number of people, it was about 12 million, followed by South Korea, which accounts for about 9.1 million, and Europe, which has 4.5 million. Nevertheless, 1975 saw a decline in the number of overseas people who visited Australia annually. Japan has the highest number, which is 3.2 million, followed by South Korea. In addition, China and the USA have 0.3 million and 0.4 million, respectively.