


The Line Graph Shows the Channel One News Viewing Figures Per Day in One Year. Summarize the Information by Selecting and Reporting the Main Features, and Make Comparisons Where Relevant.
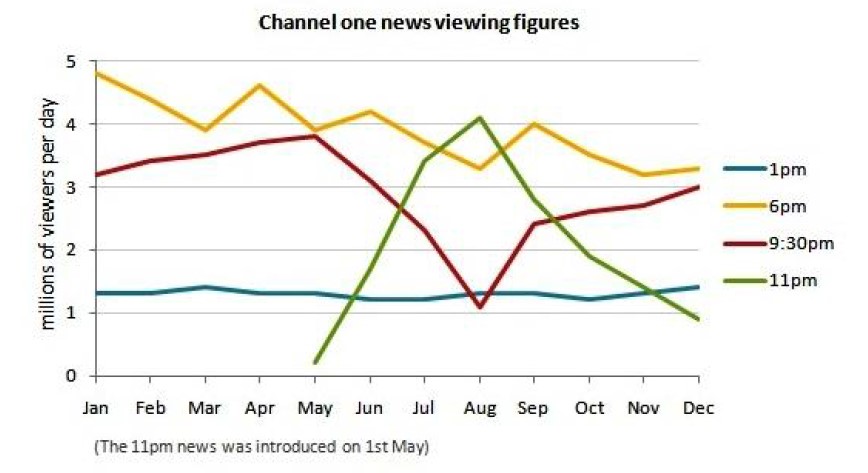

The line graph depicts how many millions watch Channel One News from January to December at different times.
Overall, it will seen that most of the viewers watch Channel One News at 6:00 p.m. However, the least number of people watched this channel at 1:00 p.m.
It is crystal clear from the chat that individuals who saw Channel One News at 6:00 p.m. were approximately 4.9 million in January. However, viewers were reduced by just about 3.9 Million in the next two months. From April to December, there was a fluctuation, and viewers who watched this channel at 6:00 p.m. reached just around 3.2 Million.
Whereas, at 9:30 p.m., just about 3.2 Million folks watched Channel One News in January, which was inclined by approximately 4.9 million in May. Whilst, in August there was sharply declined and stood at near 1 Million. Between September and December, viewing figures at 9:30 p.m. were inclined.
Follow Us On IELTSData Facebook Page For More Updates
Looking at the rest of the data, at 1:00 p.m., people’s views in January were about 1.3 Million, and it was stable at the end of the month. Human beings started watching Channel One News at 11 p.m. in May. Surprisingly, viewers sharply rose and reached 4 million in August. In December it suddenly decreased and reached below 1 Million.