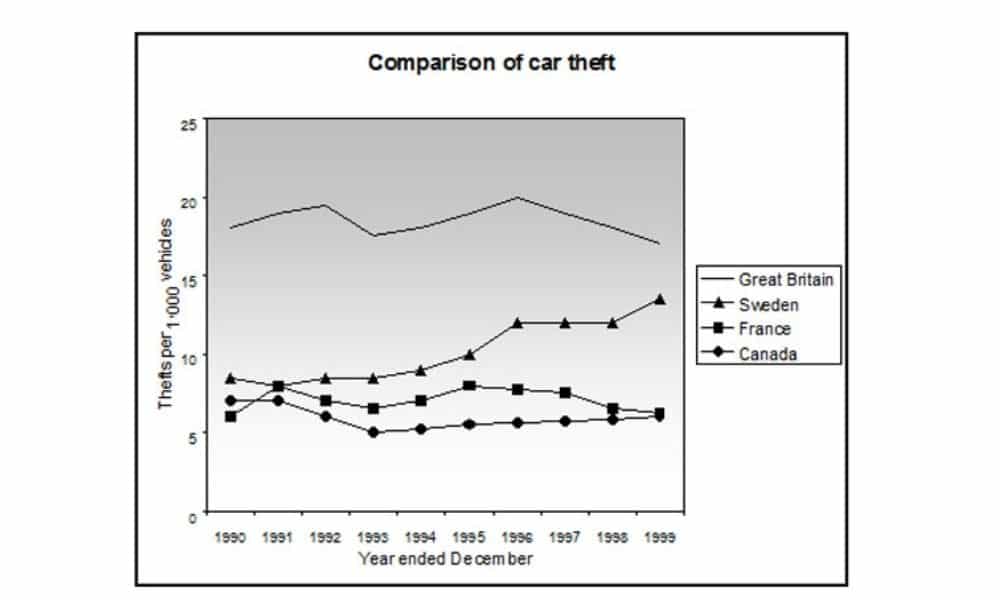
The line graph shows thefts per thousand vehicles in four countries between 1990 and 1999.
Sample Answer of The line graph shows thefts per thousand vehicles in four countries between 1990 and 1999.
The chart depicts the number of vehicles stolen in Great Britain, Sweden, France, and Canada for a period of ten years.
Overall, the number of vehicles stolen reduced from the year 1990 to 1999 for the majority of countries except that of Canada which had a spontaneous increase towards the end of December in 1999.
Great Britain had approximately 18 per 1000 vehicles stolen in 1990, it slightly increased to almost 20 per 1000 vehicles, and then fall to below 18 per 1000 in 1993 followed by a further rise to 20 per 1000 in 1996 and finally plummeted in December 1999 nearing 15 per 1000 vehicles. IELTSData Twitter Handle
France and Canada almost had the same quantity of vehicles that were taken in 1990 (nearing 10 per 1000 respectively), also, there was a reduction to almost 5 per 100 vehicles in 1993 and almost remained stable for the next six years where the number was just above 5 per 1000.
Sweden had the list number of vehicles being stolen in 1990 at just above 5 per 1000, the number surpassed that of France and Canada reaching a maximum above 10, it then went up in a sharp way slightly above 10 and finally neared 15 per 1000 at the end of 1999.
In summary, Great Britain had the greatest quantity of vehicles that were stolen in that period whereas France and Canada had the least amount of vehicles being taken by thugs.

