


The Pie Chart Shows the Amount of Money that A Children’s Charity Located in The USA spent and Received in One Year. Summarise the Information by Selecting and Reporting the Main Points and Give Comparisons Where Relevant.

Sample Answer : The Pie Chart Shows the Amount of Money that A Children’s Charity Located in The USA
The pie chart is given to illustrate information about the penny expansion received by children’s charities in the USA in a single year.
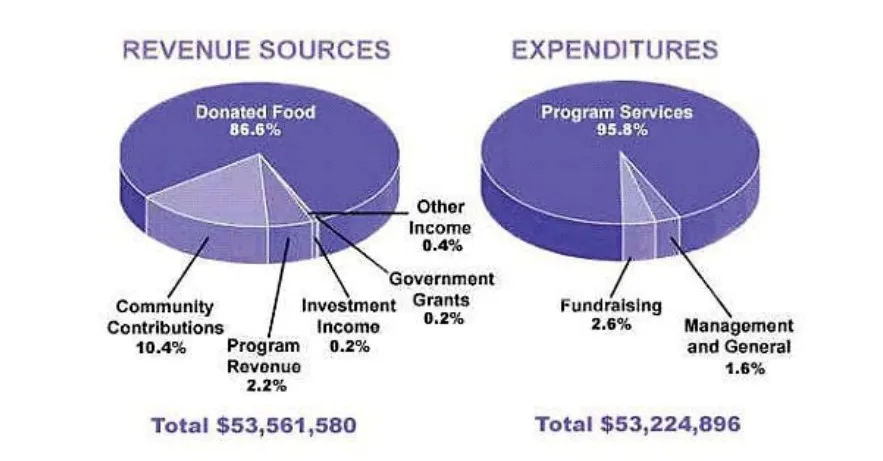
It is apparent from the very first glance that the highest money is collected through food and the lowest from other income. On the other hand, the maximum penny expands on program services and the minimum on fundraising.
Looking at the information in more detail, 86.6% of revenue was collected from donated food. Moreover, 10.4% were accepted through community contribution and 2.2% from program revenue. In addition, government grants and investment income raise some amount of income, around 0.2%, and 0.4% through other resources.
Now considering other information, charity groups spend 95.8% of their money on program services, which is the highest throughout the graph. Furthermore, when fundraising, they pay out 2.6% and exactly one per cent less on management and general. They save around 336,684 $.
In short, the highest-paid research was donated food and expanding on program services.
Follow Us on IELTSDATA Twitter