The Pie Charts Below Show the Online Shopping Sales for Retail Sectors in Australia in 2010 and 2015. Summarise the Information by Selecting and Reporting the Main Features and Making Comparisons Where Relevant.
 The pie charts below show the online shopping sales for retail sectors in Australia in 2010 and 2015. Summarise the information by selecting and reporting the main features and make comparisons where relevant.
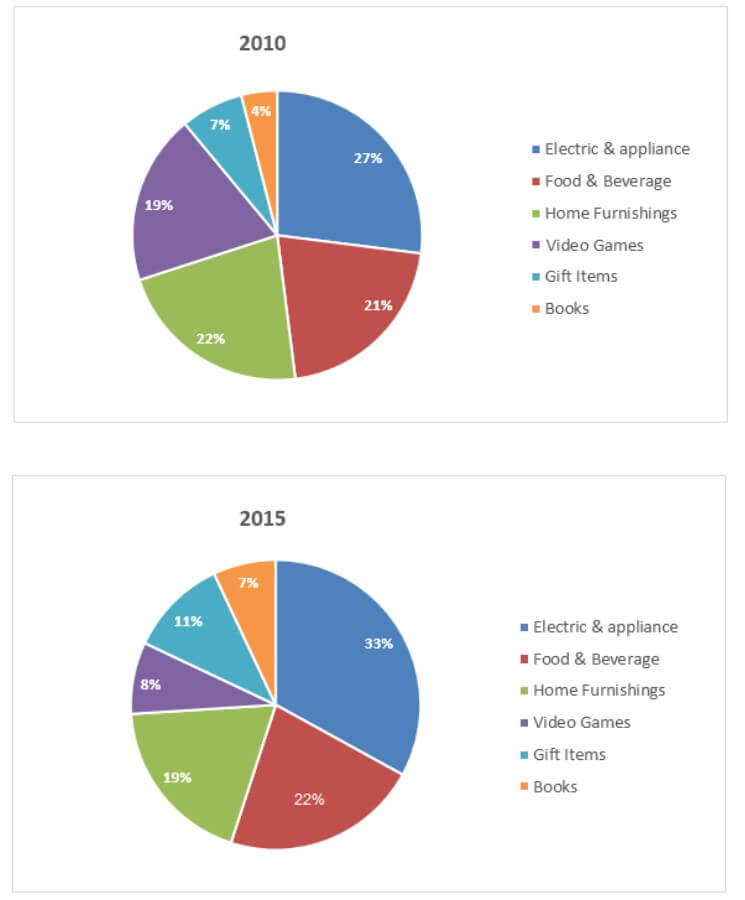
The pie charts elucidate the information about consuming items by consumers from retail sectors in Australia.
Looking from an overall perspective, it can be apparently noticed that the sales of electricity and appliances were at the top instead of others.
At first glance, in 2010, the sales of food and beverages were highest instead of those of others. Customers in Australia consumed 21% of food and drink, whereas video games were consumed only 19%. In Australia, 33% of electronics and appliances were saved, but 19% of home furnishings were sold in 2015.
Moving ahead with 2015, 11% of gift items were sold in Australia, but the sales of books in both years were less than other items.
Follow Us On IELTSData Facebook Page For More Updates for more news regarding IELTS exam and Latest Exam tests
Pingback: The Chart Below Shows the Average Daily Minimum and Maximum - IELTS DATA