The Pie Charts Illustrate the Average Time Spent by Youngsters on Different Social Media Platforms (facebook, Twitter, Instagram and Snapchat) in India from 2016 to 2020. Summarise the Information by Selecting and Reporting the Main Features, and Make Comparisons Where Relevant.
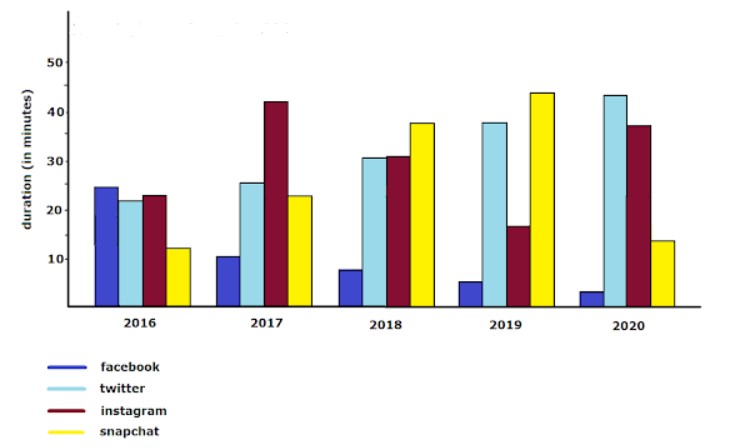
 The bar chart gives information about the amount of time younger Indians spent using social media (Instagram, Twitter, Facebook, Snapchat) between 2016 and 2020.
Overall, the number of teenagers who looked at Twitter had increased throughout these periods. While using Facebook had declined, Snapchat grew in the first interval and, thus, dropped in the last period. Likewise, Instagram users whose minutes dipped after three years have begun.
Also, Read The Graph Below Shows the Percentage of Azerbaijan’s Exports to Four
Firstly, in terms of starting these social media in 2016, Facebook had slightly more than other users, although Snapchat was a tiny fraction. In comparison, in 2017, Instagram had a sharp rise of about 40 minutes, while both Twitter and Snapchat grew slowly.
By 2018, even though Snapchat had soared substantially (Instagram, Twitter), it remained constant during this time; hence, in the next interval, like Snapchat, Instagram had jumped enormously.
In the final year, the percentage of those who looked at Twitter climbed to nearly half of accounts for the biggest minutes in 2020.
