
The Pie Charts Illustrate the Average Time Spent by Youngsters on Different Social Media Platforms (Facebook, Twitter, Instagram and Snapchat) in India from 2016 to 2020. Summarise the Information by Selecting and Reporting the Main Features, and Make Comparisons Where Relevant.
The charts describe the average time young people in India spent on various social media platforms from 2016 to 2020.
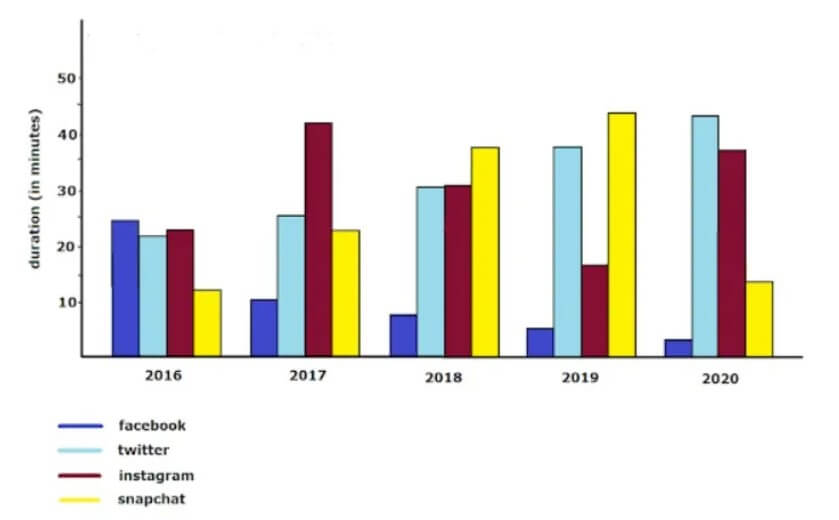
Overall, it is clear that youngsters’ time spent on Twitter saw a gradual increase over the period from 2016 to 2020, whereas that on Facebook declined.
Also, Read The Pie Charts Below Show the Average Household Expenditures in A Country
To begin with, the average time young people spent on Twitter in 2016 was a little above 20 minutes, and this surged gradually from 2016 – 2020, finishing at about 45 minutes.
Again, the minutes spent on Snapchat in 2016 were a bit above 10 minutes, which also increased significantly through 2016-2019, arriving at about 45 minutes as the use of Twitter, but there was a decrease in the time spent to a little below 20 minutes in 2020.
Further, the time spent by youngsters on Instagram fluctuated from a little above 20 minutes to about 40 minutes in 2017, again depreciating until 2019 and then appreciating to 40 minutes in 2020.
Follow Us On IELTSFever Facebook Page For More Updates
However, the time spent on Facebook saw a decline over the period of 2016-2020 from about 20 minutes to a little below 5 minutes.