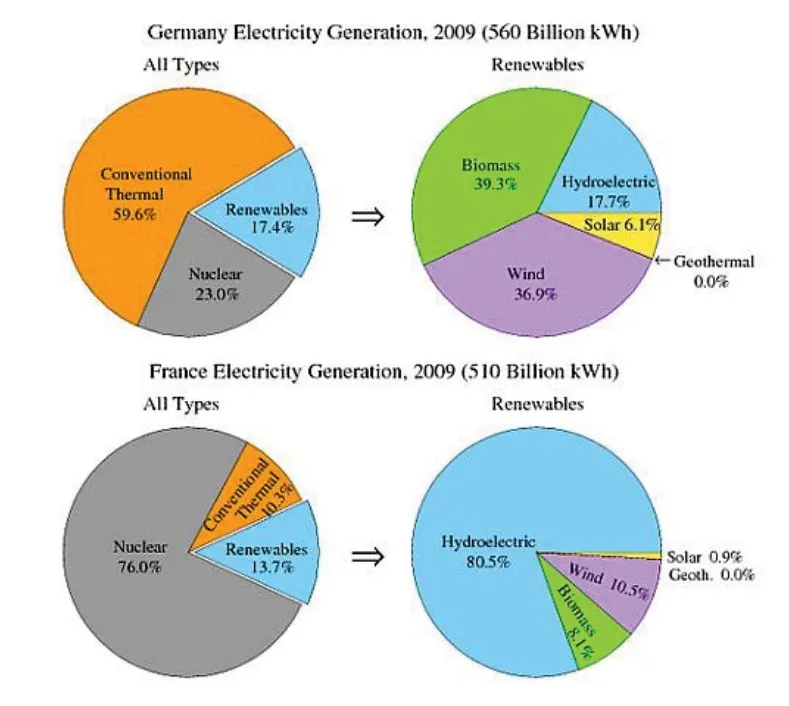
The pie charts show the electricity generated in Germany and France from all sources and renewables in the year 2009.
Sample question for The pie charts shows the electricity generated in Germany and France from all sources and renewables in the year 2009.

The pie charts given represent the Information regarding how electricity was produced by using all sources and Renewable Sources in Germany and France during the period of 2009.
Overall, it is crystal clear from the illustrations that in both countries, the demand for solar energy was less used than other sources.
At a fleeting glance, it is noticeable that in terms of all sources, most of the electricity was generated by conventional Thermal Power, which comprised 59.6% in value. Renewables were less in demand within the percentage of 17.4. On the other side, in France, the demand for nuclear power to generate electricity was high, and conventional thermal sources were used less.
Regarding renewable comma, 39.3% of electricity was produced by biomass, which was high in ratio compared to wind and hydroelectric power, which were 36.9% and 17.7%, respectively. However, in France, the utilization of hydroelectric power was on the top with a ratio of 80.5%; on the other hand, Solar Power was less in usage.
Follow us on Ieltsdata/Twitter