
The Table Below Shows Changes in The Number of Residents Cycling to Work in Different Areas of The Uk Between 2001 and 2011. Summarise the Information by Selecting and Reporting the Main Features, and Make Comparisons Where Relevant.
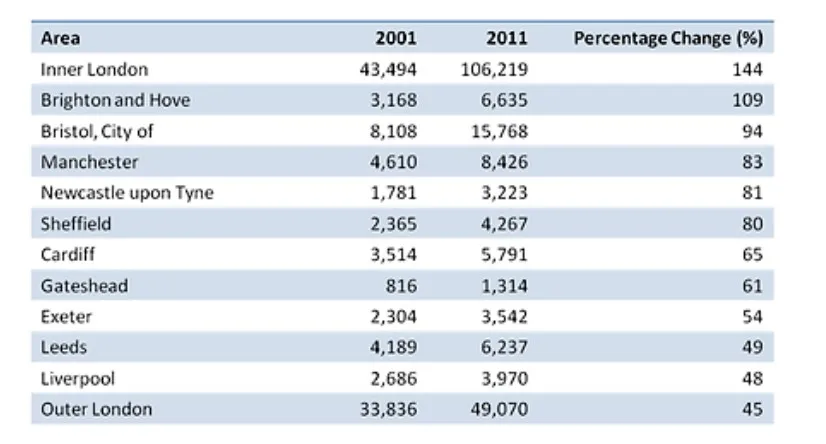
The table provides information on the changes in the population of UK residents from different parts of the country that ride a bicycle to work between 2001 and 2011.
Overall, the most significant population change happened in inner London, which amounts to 144 per cent changes although this is just slightly greater than that of Brighton and Hove, which is 109 per cent. However, cyclers from inner London recorded in both years are far greater than Brighton and Hove.
The changes in cycles between the two periods in Bristol, Manchester, Newcastle upon Tyne, Sheffield, Cardiff, Gateshead, and Exeter are more significant than 50 per cent but not up to 100. Furthermore, the margin between the percentage change of these areas is not large, and the values are 94,83,81,80,65,61,54, respectively.
The difference in the number of residents in Leeds, Liverpool, and outer London that travel to work by cycling between 2001 and 2011 is slightly under 50 per cent.
Follow Us on IELTSDATA Twitter