The Table Below Shows the Percentage of Household and Electronic Goods in New Zealand in 2002 and 2020. Summarise the Information by Selecting and Reporting the Main Features and Making Comparisons Where Relevant.
 Sample Answer: The Table Below Shows the Percentage of Household and Electronic
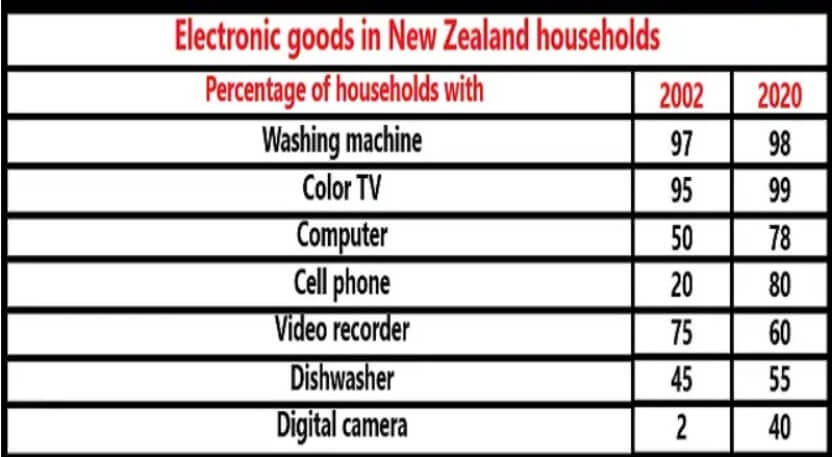
The table elaborates on the proportion of electrical appliances in households in New Zealand in 2002 and 2020.
Overall, the table shows that most households in New Zealand increased their electrical appliances in the latter year; cell phones had a more significant increase than the others.
Also, Read The Charts Below Show the Percentage of Food Budget the Average
To begin with, electronic goods in New Zealand in 2002 included washing machines, colour TVs, computers, and cellphones, with percentages of 97,95,50 and 20 respectively.
In 2020, the proportions of washing machines and colour TVs remained almost constant, with computers and cell phones increasing to a little above three-thirds for both.
Furthermore, electrical gadgets like video recorders, dishwashers, and digital cameras were 75, 45, and 2 in percentage, respectively.
Over the period, these gadgets in New Zealand households saw an inclination with dishwashers and digital cameras to 55 and 40, while video recorders saw a decline from 75 to a little above half.
Follow Us On IELTSFever Facebook Page For More Updates