


The Table Below Shows the Proportion of Different Categories of Families Living in Poverty in Australia in 1999. Write a Report for A University Lecturer Describing the Information Shown Below. Make Comparisons Were Relevant.

The table depicts the percentages of various categories of families who are poor among the Australian populace in the year 1999.
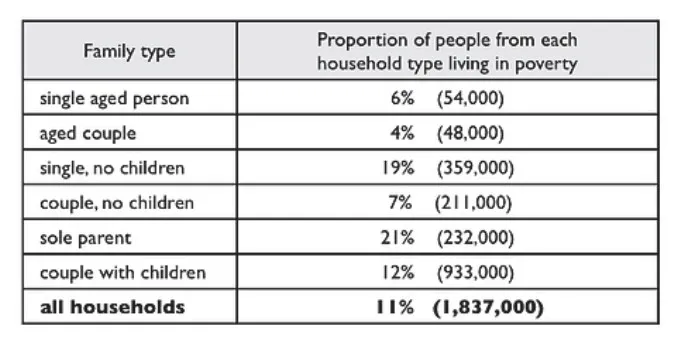
Overall, every residence described among Australians witnessed a significant rate of poverty. While single parents were the most impoverished by percentage, all households accounted for the most significant number of individuals battling penury.
To begin with, the entire households in Australia faced some degree of poverty at 11% but estimated to be 1837,000 people affected. The percentage of single-parent who found it difficult to make ends meet peaked at 21%, equivalent to 232,000 populace involved. Similarly, singles without offspring and married people with children stood at 19% and 12%, calculated to be 359,000 and 933,000 citizens affected by finances, respectively.
Furthermore, couples having no child were calculated to experience poverty at 7%, with 211,000 individuals included. Also, single old personnel accounted for 6% of citizens in penury, making up 54,000 people in this category. Lastly, married-aged people filled the most diminutive figure of 4%, with 48,000 individuals battling with poverty among this set in Australia.
Follow Us on IELTSDATA Twitter