The Table Shows the Proportion of Pupils Attending Four Secondary School Types Between 2000 and 2009. Summarise the Information by Selecting and Reporting the Main Points and Give Comparisons Where Relevant.
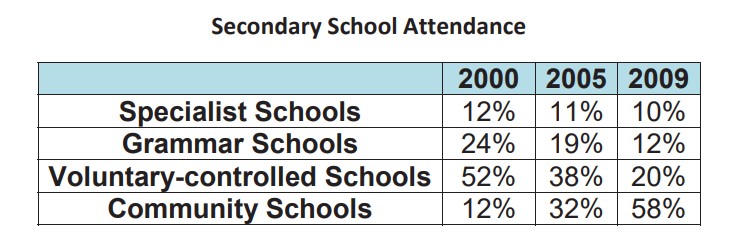 The table depicts the percentage of students enrolled in four different kinds of schools from 2000 to 2009. In 2000, voluntary schools headed the proportion of students at 52%, which was higher than the percentage of pupils enrolling in grammar schools at 24%. Twelve per cent of students attended specialist schools and community schools, respectively.
In 2009, the percentage of pupils going to voluntary controlled schools declined dramatically to only 20%. Grammar schools and specialist schools also saw a slight decrease to 12% and 10%, respectively. In contrast, 2009 witnessed a significant increase in student attendance in community schools, from 12% in 2000 to 58% in 2009.
Overall, it is clear that the proportion of students attending specialist schools and voluntary controlled schools decreased, while this figure for community schools increased.
Follow Us on the IELTSData Facebook Page for More Updates