


The Table Shows the Proportion of Pupils Attending Four Secondary School Types Between 2000 and 2009. Summarise the Information by Selecting and Reporting the Main Points and Give Comparisons Where Relevant.
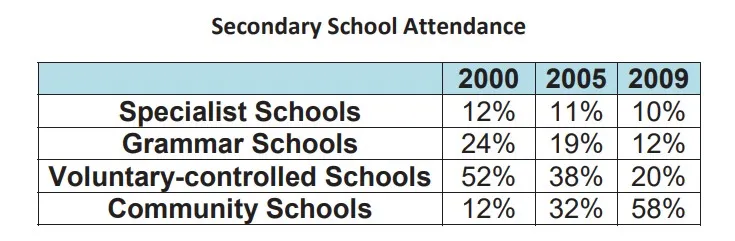

The table illustrates how many students attended four types of secondary school in the years and 2000,2005 and 2009—the data given in percentage.
Overall, In the beginning, time highest number of attendance is voluntary. Controlled schools and the lowest number of attendance in specialist and community schools. While in the ending time period the highest number of pupils attended community schools. However, few pupils attended specialist schools.
To begin with, In 2000,12% of students attending community schools. Moreover, the same percentage of students attended specialist schools. Grammar schools had 24% attendance, and voluntary controlled schools had above 50% students attend, which was highest in the year 2000. In addition, students attended specialist schools and grammar schools at 11% and 19%, respectively. Voluntary-controlled and community schools were the highest in 2005, 38% and 32%, respectively.
In addition, In 2009, students attended specialist schools, which was only 10%, which was 2% lower than grammar schools in the same year. Voluntary-controlled schools show a dramatic decline trend and ended up with only 20%, while Community schools had 58% students attendance in 2010, which is an all-time high in four types of schools.
Follow Us on IELTSDATA Twitter