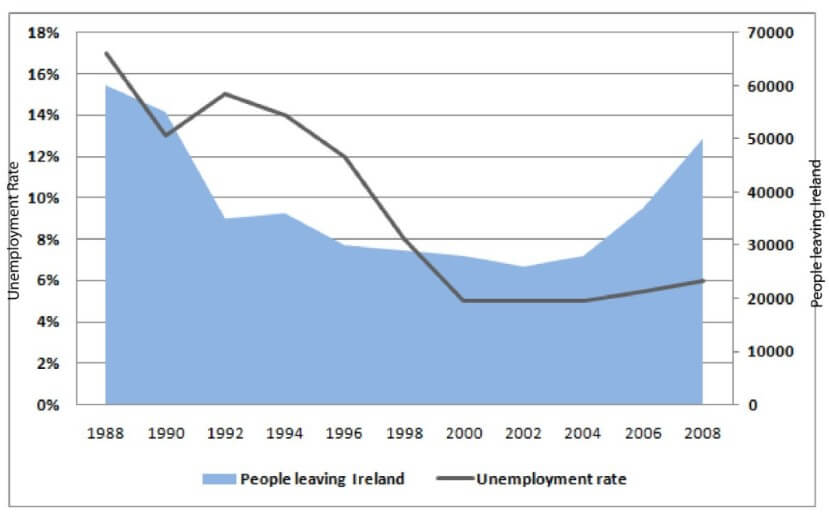
Unemployment Rate in Ireland. Summarise the information by selecting and reporting the main features and make comparisons where relevant.
 Sample Answer: Unemployment Rate in Ireland: AC Writing Task 1
The given line graph illustrates the information related to the percentage of jobless individuals and the number of people who live in Ireland over twenty years between 1988 and 2008.
Overall, the line chart reveals that unemployment went down in the 21st century. Another interesting fact is that the population ratio also decreased, but at the end of the period, it increased significantly.
In 1988, around 610,000 people lived there, and 17% were unemployed. However, this ratio dropped to 55,000 in 1990, and approximately 14% of the population was jobless. However, in 1992, the margin between unemployment and people living became large, with 15% of the population unemployed and only around 32500 living there.
In the next six years, the ratio became balanced, with under 8% of people jobless out of about 38,000 people. In 2000, the trend remained the same, and the unemployment rate went down to around 6%. It stabilized at the end of the period, but the population rate increased between 2004 and 2008.
Follow Us On IELTSData Facebook Page For More Updates
