According to United Nations Statistics, the Chart Below Gives Information About Birth and Death Rates in Switzerland from 1975 to 2025. Summarise the Information by Selecting and Reporting the Main Features and Making Comparisons Where Relevant.
 Sample 1: According to United Nations Statistics the Chart Below Gives Information About Birth
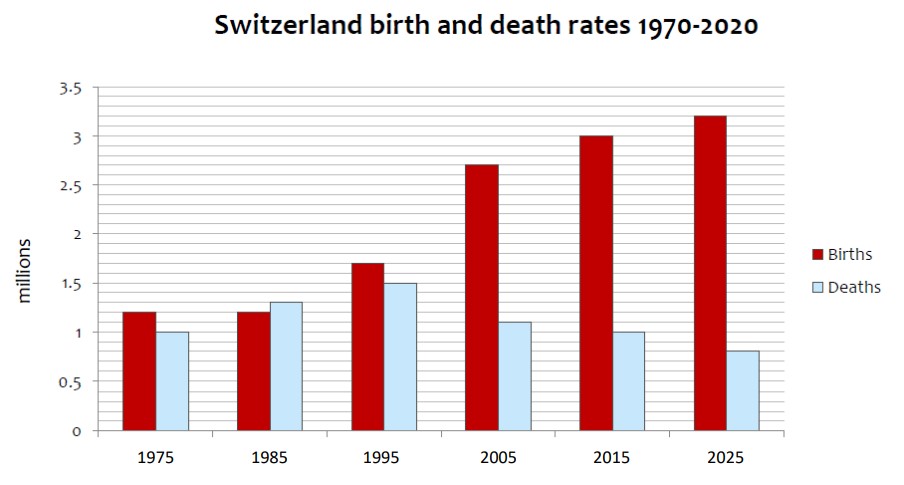
According to the projection of United Nations statistics between 1975 and 2025. The information regarding the birth and death rate in Switzerland is depicted by a rendered bar graph. The data has been calibrated in millions.
Overall, it can be vividly manifested that, as per the forecast, the maximum proportion of births will be in the final year whilst the lowest percentile of death rate in the initial year.
The bar graph shows a negligible difference between the birth and death rates in 1975 in Switzerland. In contrast, after ten years. The death rate in Switzerland was nearly 1.25 million; however, it declined by 0.05 million. Nevertheless, in 1995, the birth and death rates were 1.5 million and approximately 1.75 million, respectively.
Probing the death rate was more than 1.75 million as against the nearly 1 million birth rate. Nonetheless, according to the prediction, the birth rate in 2025 tops the list. While the death rate will be lower than 1 million in Switzerland. The death rate in Switzerland in 2015 was 1 million, which escalated to a 3 million birth rate.
Sample 2: According to United Nati ons Statistics the Chart Below Gives Information About Birth
The given bar graph illustrates the data on death and birth rates in Switzerland in the period between 1975 to 2025, based on the United Nations statistics. The birth rate will be high in 2025 when compared with the earlier days. And the death rate will decrease in 2025 when compared with 2015 and 2005.
One of the striking points is that, in 1995, it showed a high rate of death rate and after that gradually it has been decreased. In addition, in 1985, the birth rates were approximately the same, and the death rate was higher than the birth rate.
So it is clear that, in 1985, the medical facilities couldn’t make any positive progress in the sector. The lowest death rate and the highest birth rate will be in 2025. Therefore, it gives a clue that, in 2025, the medical field and the health of people will be at an advanced level of living.