IELTSData Reading Passage 110 – The Lost City
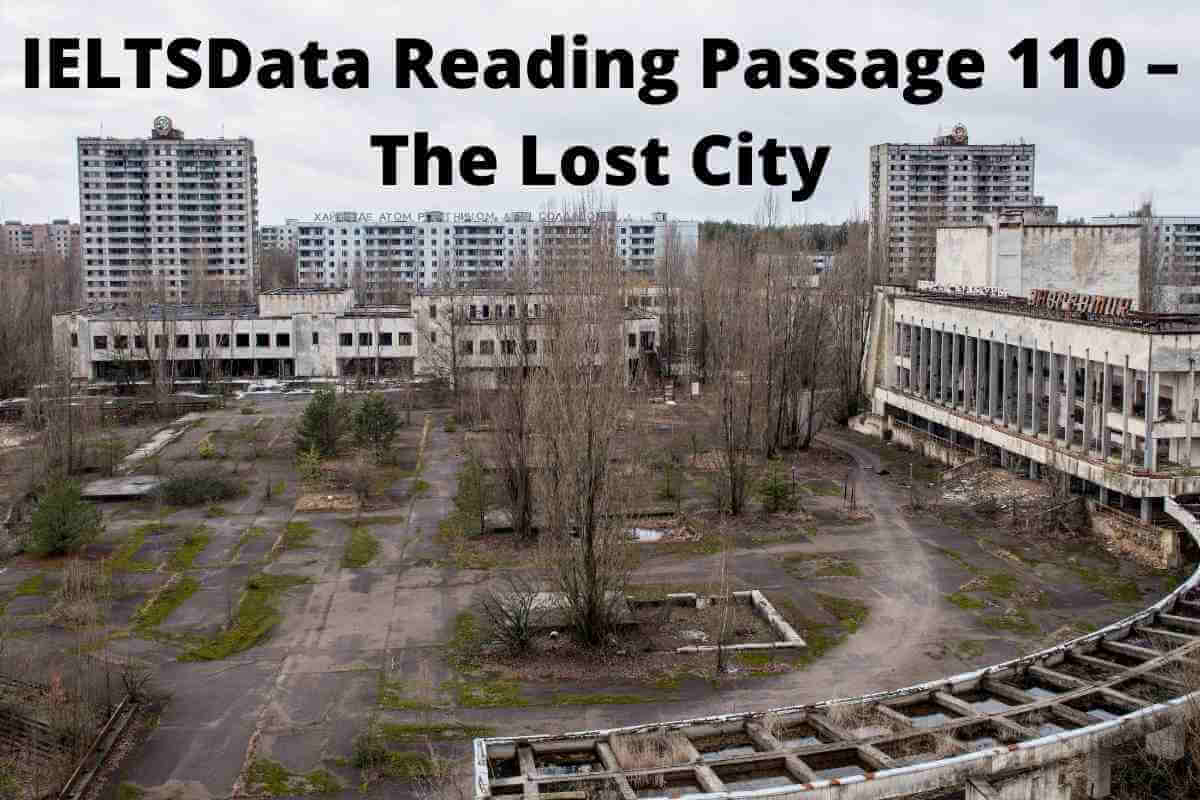
IELTSData Reading Passage 110 – The Lost City The Lost City Thanks to modern remote-sensing techniques, a ruined city in Turkey is slowly revealing itself as one of the greatest and most mysterious cities of the ancient world. Sally Palmer uncovers more. {A} The low granite mountain, known as Kerkenes Dag, juts from the northern edge … Read more