ACADEMIC WRITING

The Pie Charts Below Show the Online Shopping Sales for Retail Sectors in Australia in 2010 and 2015

The Pie Charts Below Show the Online Shopping Sales for Retail Sectors in Australia in 2010 and 2015

The pie charts below show the online shopping sales for retail sectors in Australia in 2010 and 2015. Summarise the information by selecting and reporting the main features and make comparisons where relevant. The pie charts elucidate information about online shopping sales in retail sectors in Australia in 2010 and 2015. Overall, it can be […]

The Pie Charts Below Show the Online Shopping Sales for Retail Sectors in Australia in 2010 and 2015 Read More »

The Chart Below Shows the Figure for Work Hours per Week in The Industrial Sector

The chart below shows the figure for work hours per week in the industrial sector in four European countries in 2002. Summarise the information by selecting and reporting the main features, and make comparisons where relevant. The charts predicted the compare and contrast difference in the number of hours of job per week in the

The Chart Below Shows the Figure for Work Hours per Week in The Industrial Sector Read More »

Describe a Time when Received Money as A Gift on Your Birthday

Describe a Time when Received Money as A Gift on Your Birthday

Describe a time when you Received Money as A Gift on Your Birthday. You Should Say: When Did You Receive It? What Did You Do with It? How Did You Feel About It? Sample: Describe a time when you Received Money as A Gift on Your Birthday Well. I received many gifts in my lifetime,

Describe a Time when Received Money as A Gift on Your Birthday Read More »

The Chart Below Shows What Anthropology Graduates from One University

The Chart Below Shows What Anthropology Graduates from One University

The Chart Below Shows What Anthropology Graduates from One University Did After Finishing Their Undergraduate Degree Course. The Table Shows the Salaries of The Anthropologist’s Work After Five Years. Summarise the Information by Selecting and Reporting the Main Features and Making Comparisons Where Relevant. The pie chart represents the percentages of the amount spent by

The Chart Below Shows What Anthropology Graduates from One University Read More »

Some People Believe that Reading Stories from A Book Is Better

Some People Believe that Reading Stories from A Book Is Better

Some People Believe that Reading Stories from A Book Is Better than Watching Tv or Playing Computer Games for Children. to What Extent Do You Agree or Disagree? In the case of children, few people think that Spending time reading novels or publishing is more beneficial than wasting time watching television or playing games on

Some People Believe that Reading Stories from A Book Is Better Read More »

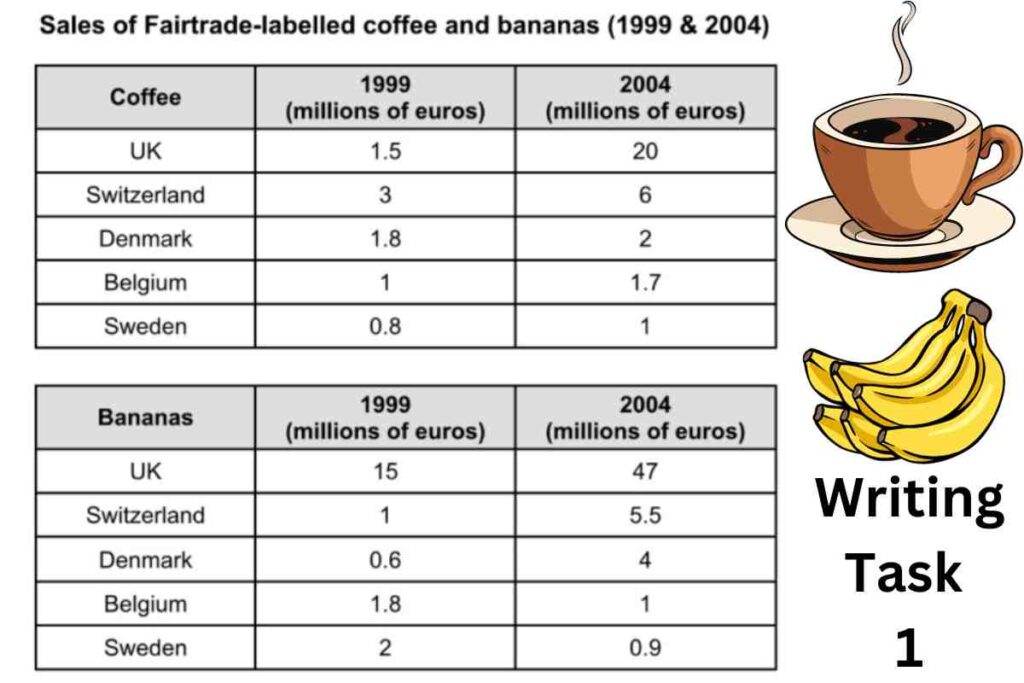
The Tables Below Give Information About Sales of Fairtrade-Labelled Coffee and Bananas

The Tables Below Give Information About Sales of Fairtrade-Labelled Coffee and Bananas

The Tables Below Give Information About Sales of Fairtrade-Labelled Coffee and Bananas in 1999 and 2004 in Five European Countries. Summarise the Information by Selecting and Reporting the Main Features and Making Comparisons Where Relevant. Sample 1:- The Tables Below Give Information About Sales of Fairtrade-Labelled Coffee and Bananas The table illustrates the details of

The Tables Below Give Information About Sales of Fairtrade-Labelled Coffee and Bananas Read More »