ACADEMIC WRITING

The Charts Below Show the Percentage of Water Used for Different Purposes in Six

The Charts Below Show the Percentage of Water Used for Different Purposes in Six

The Charts Below Show the Percentage of Water Used for Different Purposes in Six Areas of The World. Summarise the Information by Selecting and Reporting the Main Features, and Make Comparisons Where Relevant. Sample Answer: The Charts Below Show the Percentage of Water Used for Different Purposes in Six The graph illustrates data on how […]

The Charts Below Show the Percentage of Water Used for Different Purposes in Six Read More »

The Diagram Below Shows the Typical Stages of Consumer Goods Manufacturing

The Diagram Below Shows the Typical Stages of Consumer Goods Manufacturing

The Diagram Below Shows the Typical Stages of Consumer Goods Manufacturing, Including the Process by Which Information Is Fed Back to Earlier Stages to Enable Adjustment. Write a Report for A University Lecturer Describing the Process Shown. Sample Answer: The Diagram Below Shows the Typical Stages of Consumer Goods Manufacturing The flow chart illustrates about

The Diagram Below Shows the Typical Stages of Consumer Goods Manufacturing Read More »

The Graph Gives Information About the Percentage of The Population Of Four Different

The Graph Gives Information About the Percentage of The Population Of Four Different

The Graph Gives Information About the Percentage of The Population Of Four Different Asian Countries Living in Cities Between 1970 and 2020, with Additional Predictions for 2030 and 2040. Summarize the Information by Selecting and Reporting the Main Features and Making Comparisons Where Relevant. The graph displays data about the proportion of citizens of four

The Graph Gives Information About the Percentage of The Population Of Four Different Read More »

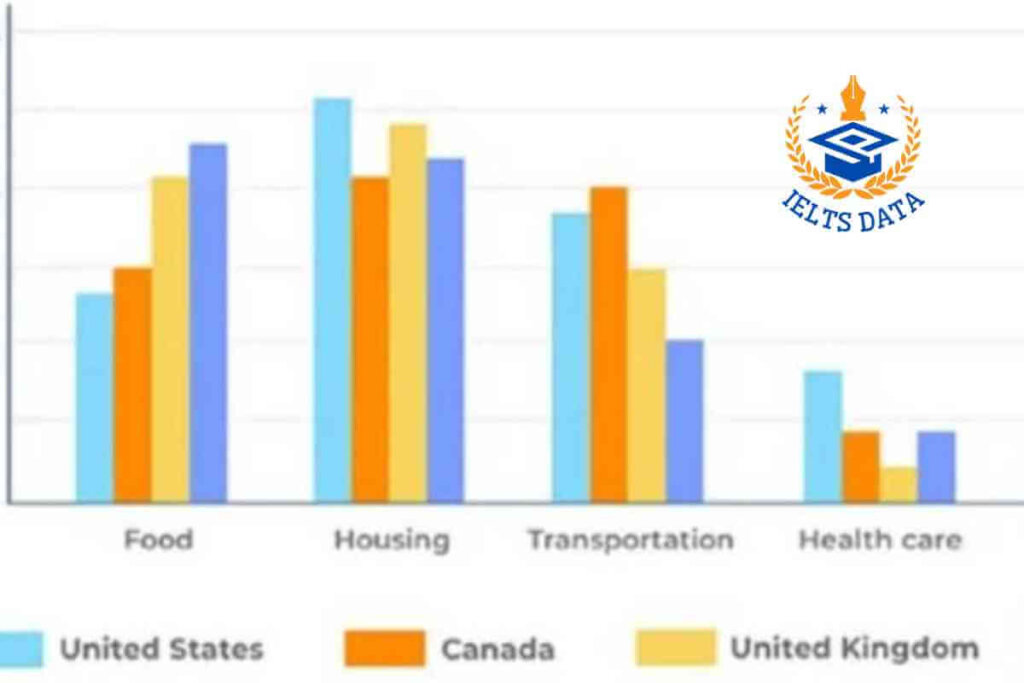
The Bar Chart Below Shows Shares of Expenditures for Five Major Categories in The United States

The Bar Chart Below Shows Shares of Expenditures for Five Major Categories in The United States

The Bar Chart Below Shows Shares of Expenditures for Five Major Categories in The United States, Canada, the United Kingdom, and Japan in The Year 2009. Summarise the Information by Selecting and Reporting the Main Features and Making Comparisons Where Relevant. Sample Answer: The Bar Chart Below Shows Shares of Expenditures for Five Major Categories

The Bar Chart Below Shows Shares of Expenditures for Five Major Categories in The United States Read More »

You Currently Live in A Rental Apartment, and The Noise from Your Neighbours

You Currently Live in A Rental Apartment, and The Noise from Your Neighbours

You Currently Live in A Rental Apartment, and The Noise from Your Neighbours Disturbs You. Write a Letter to Your Landlord. in Your Letter. Describe how This Situation Affects You; Explain What Steps You Have Taken to Address the Problem; Ask the Landlord to Take Action to Resolve the Issue. Dear landlord, I write with much

You Currently Live in A Rental Apartment, and The Noise from Your Neighbours Read More »

The Table Below Gives Information About the Underground Railway Systems in Six Cities

The Table Below Gives Information About the Underground Railway Systems in Six Cities

The Table Below Gives Information About the Underground Railway Systems in Six Cities. Summarise the Information by Selecting and Reporting the Main Features and Making Comparisons Where Relevant. The table provides information about the underground railway transportation systems in kilometres of route and passengers per year in millions in the following cities: London, Paris, Tokyo,

The Table Below Gives Information About the Underground Railway Systems in Six Cities Read More »