The Bar Chart Below Shows Shares of Expenditures for Five Major Categories in The United States, Canada, the United Kingdom, and Japan in The Year 2009. Summarise the Information by Selecting and Reporting the Main Features and Making Comparisons Where Relevant.
 Sample Answer: The Bar Chart Below Shows Shares of Expenditures for Five Major Categories in The United States
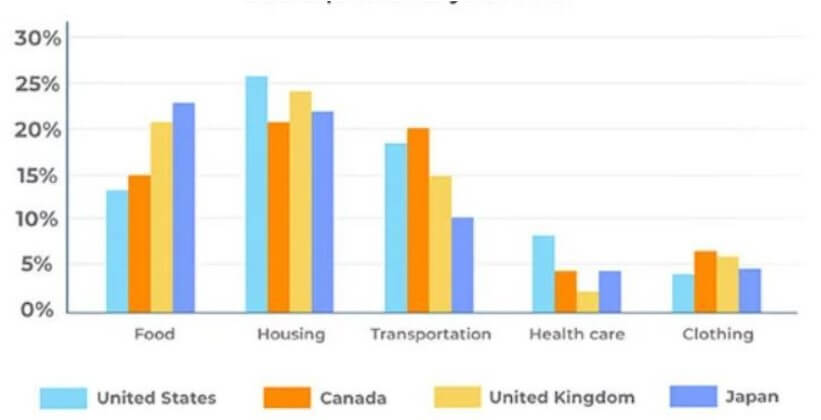
The bar chart shows the shares of expenses for five main categories (food, housing, transportation, healthcare, and clothing) in the United States, Canada, the United Kingdom, and Japan.
Overall, the United States spent the most on housing, while the United Kingdom spent the least on healthcare.
Also, Read The Chart Below Shows the Internet Users (in Millions) in Different
For the feeding section, Japan had the highest consumption, followed by the UK at 20%, then Canada at 15%, and lastly the USA at around 13%. Furthermore, the housing category of the USA topped among all at 25%, while the UK followed suit with just around 24%band Japan and Canada were around 20%. In the transportation sector, Canada had the most expenses at 20% while the USA, UK, and Japan had 18%, 15%, and 10% each.
The healthcare category had among the lowest expenditures. The USA had the highest at around 7%, and the other countries were all below 5%. The clothing sector also had lower percentages, around 6% in both Canada and the UK; Japan and the USA had below 5%.
Follow Us On IELTSFever Facebook Page For More Updates