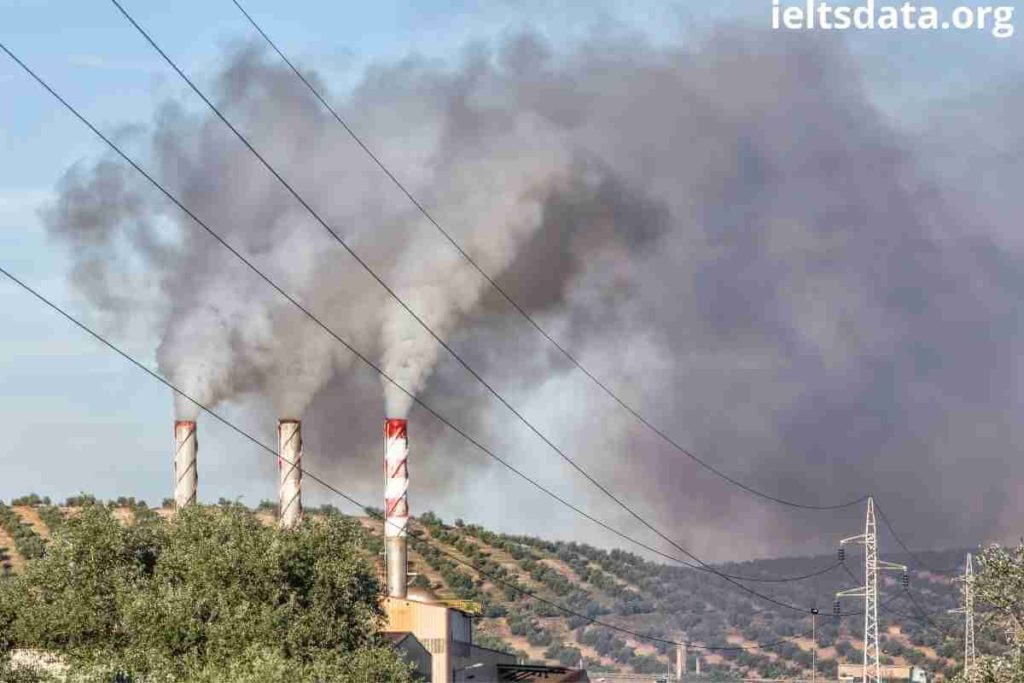
The Following Diagram Shows how Greenhouse Gases Trap Energy from The Sun (1)

The Following Diagram Shows how Greenhouse Gases Trap Energy from The Sun

The following diagram shows how greenhouse gases trap energy from the Sun. Write a report for a university lecturer describing the information shown in the diagram. Summarise the information by selecting and reporting the main features and making comparisons where relevant Sample Answer of The Following Diagram Shows how Greenhouse Gases Trap Energy from The

The Following Diagram Shows how Greenhouse Gases Trap Energy from The Sun Read More »

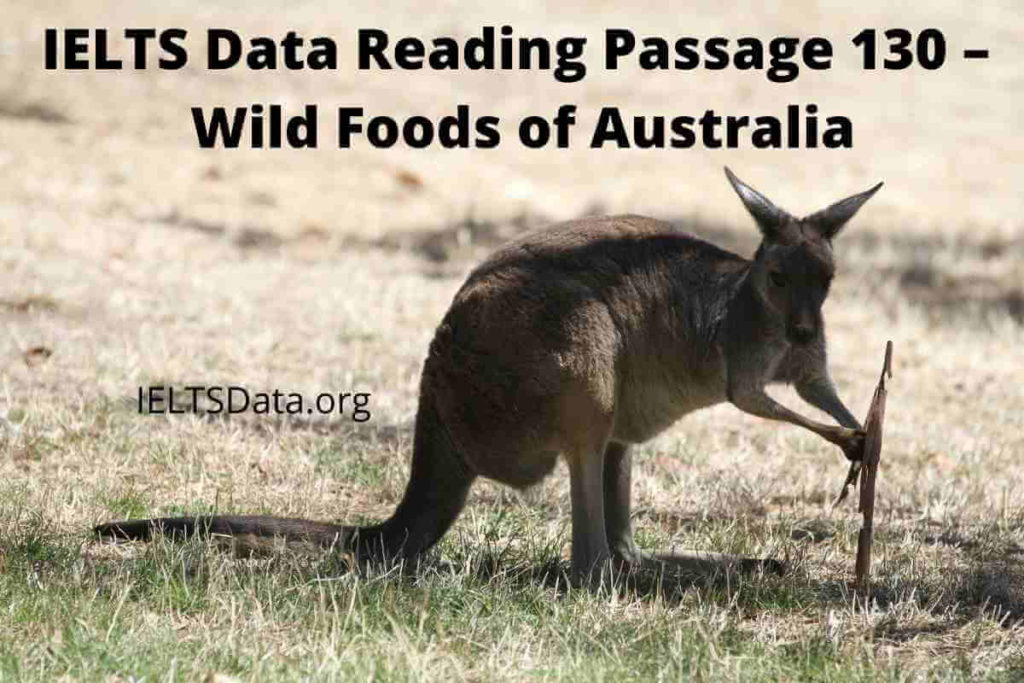
IELTS Data Reading Passage 130 – Wild Foods of Australia

IELTS Data Reading Passage 130 – Wild Foods of Australia

IELTS Data Reading Passage 130 – Wild Foods of Australia You are advised to spend about 20 minutes on Questions 1 – 13 which refer to IELTS Data Reading Passage 130 – Wild Foods of Australia Passage below Wild Foods of Australia Over 120 years ago, the English botanist J. D. Hooker, writing of Australian

IELTS Data Reading Passage 130 – Wild Foods of Australia Read More »

IELTS Data Reading Passage 128 – Water Treatment 2: Reed Bed

IELTS Data Reading Passage 128 – Water Treatment 2: Reed Bed

IELTS Data Reading Passage 128 – Water Treatment 2: Reed Bed Water Treatment 2: Reed Bed {A} Nowadays subsurface flow wetlands are a common alternative in Europe for the treatment of wastewater in rural areas. mainly in the last 10 to 12 years, there has been significant growth in the number and size of the

IELTS Data Reading Passage 128 – Water Treatment 2: Reed Bed Read More »