The Bar Charts Below Show the Marriage and Divorce Statistics for Nine Countries in 1981 and 1994. Write a Short Report for A University Lecturer Describing the Information Is Shown Below.
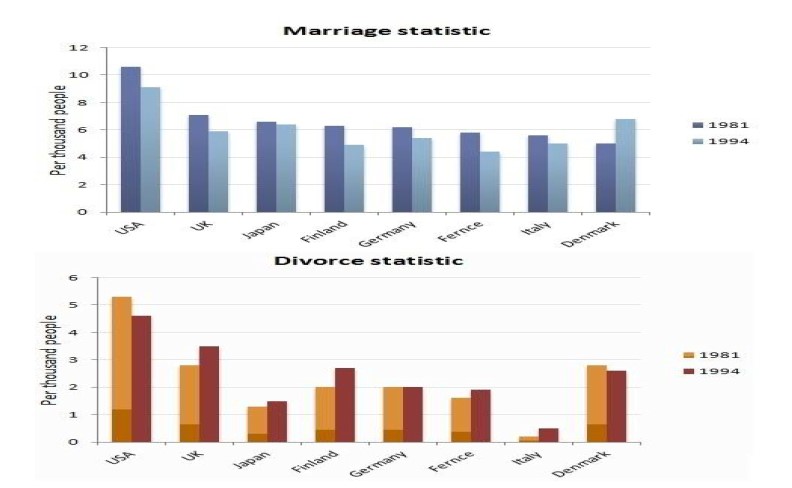
The bar graph represents the marriage and divorce data from 9 nations in 1981 and 1991 is illustrated by in per thousand people.
By having a quick lens at the table, The United States has the highest proportion of marriage and divorce, accounting for 1000 and 5000 between 1981 and 1994. The UK has the second number in marriage and separation, accounting for approximately 7000 and 4000.
Moreover, Denmark has nearly 7000 and 3000 full stops. In addition, the data for Japan and Germany on married people is almost the same with 6000.
Besides that, Delhi has the lowest number of couples separated after marriage, below 1000. In addition and same as Germany, and 2000 counting in divorces full stop apart from that France almost matches in the number of marriages, near 6000 and below 2000 in divorces.
Follow Us On IELTSData Facebook Page For More Updates
Overall, successful marriages in Italy, Japan, France and Germany are full stop apart from this USA and Denmark couples are top up in the list of marriage and suitable devices between 1981 and 1994.