The Bar Graph Shows the Global Sales (in Billions of Dollars) of Different Types of Digital Games Between 2000 and 2006. Summarize the Information by Selecting and Reporting the Main Features, and Make Comparisons Where Relevant.
 Sample Answer: The Bar Graph Shows the Global Sales (in Billions of Dollars) of Different Types of Digital Games
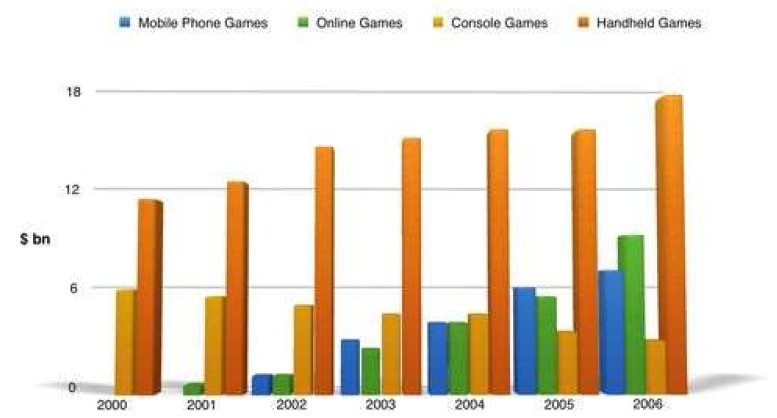
The diagram gives information about the global sales of various digital games, such as mobile phone games, online games, console games, and handheld games, from 2000 to 2006.
From an oral analysis, it is clear that handheld games accounted for an upward trend compared to other games, whereas console games recorded a downward trend in a given period.
Also, Read The Pie Charts Below Compare Water Usage in San Diego
To begin with, handheld games, only 13 billion dollars were sold out in the year 2000. This figure steadily increased and peaked at approximately 18 billion dollars in 2006. Next, 2000 consoles were sold out by almost 6 billion dollars, dropping by 3 billion dollars in later years. However, the trend of console games remained equal in 2003 and 2004, which was nearly 4 billion dollars in both years.
Furthermore, the lowest number of online games sold in 2001 accounted for 1 billion dollars, and this statistic steadily expanded by 1 billion dollars until 2005 and climbed up by 9 billion dollars in 2006; similar to online games, the highest selling of mobile phone games were seen at the end of the period around 7 billion dollars, which was quite a high amount as compared to other years.
In contrast, the minimal selling of that game was around 2 billion dollars in 2002.
Follow Us On Facebook IELTSData Page
Pingback: Describe a Time You Used Your Cellphone/smartphone to Do Something Important. - IELTS DATA