The Pie Charts Below Compare Water Usage in San Diego, California and The Rest of The World. Summarise the Information by Selecting and Reporting the Main Features and Make Comparisons Where Relevant.
The pie charts provided the details of the percentage of water consumption in San Diego, California and other areas of the world.
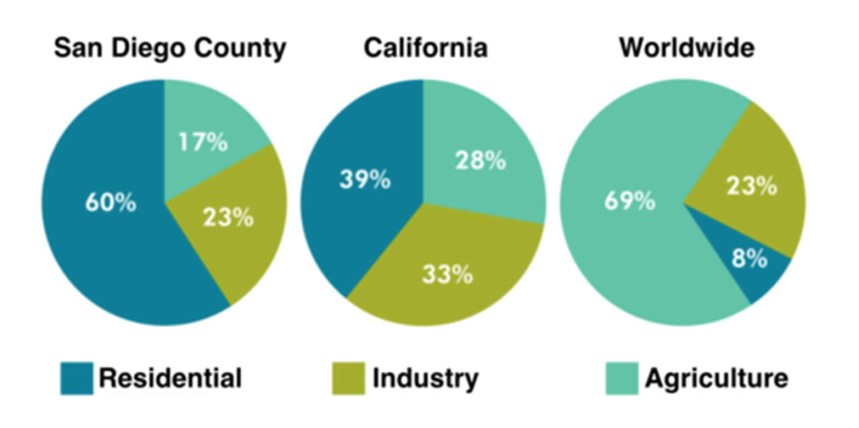
At a cursory glance, water is consumed for several purposes like industry, agriculture and residential. A significant portion of water is used for agriculture worldwide, and more than half the ratio is used for residential purposes in San Diego County.
In detail, water consumption is different in different sectors as well as in different areas. In San Diego County, about 60% of water is used for residential purposes; in California, almost 40% is used for such purposes.
If we consider the industry sector, almost a third portion of water is taken, and in San Diego, it is about a quarter only. The water consumption for agricultural purposes is also less in these cities. San Diego and California use around 20% and 30% of water, respectively.
Follow Us On IELTSData Facebook Page For More Updates
It is entirely different in the consumption of water worldwide. A larger water ratio is used for agricultural purposes, and about a quarter part is used in the industry sector. Only a tenth portion of water is used for residential purposes by people worldwide.