The Chart Below Gives Information About the Number of Books Rented in A British Local Library in 2009. Summarise the Information by Selecting and Reporting the Main Features, and Make Comparisons Where Relevant.
Sample 1: The Chart Below Gives Information About the Number of Books Rented
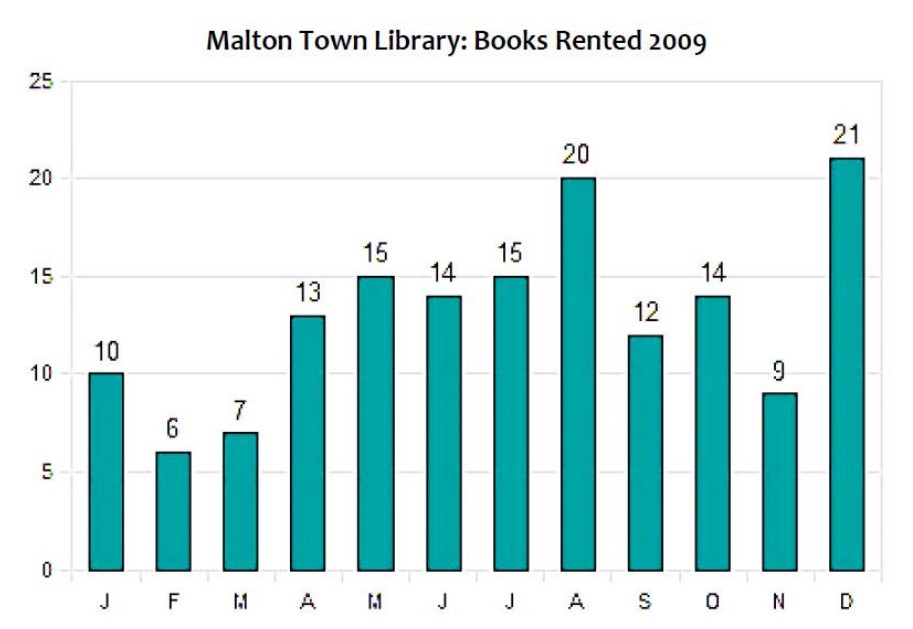
The bar chart depicts the total number of books people rent in British local libraries in one year. Overall, it is seen that the highest number of books were rented in August and December. While the lowest number of books were leased by people in February and March.
In January, the total number of rented books was 10. However, a downward trend was recorded with a negligible difference between the books rented in February and March. In the next month, the demand for leased books sharply increased, and the same trend was followed in the next month. Furthermore, the figures for June and July show the ups and downs in the books which people rented.
In August, the demand increased drastically and reached 20. Afterwards, people were less interested in taking the books in September and October. While November month also showed a downward trend. Only nine books were on the lease. In the last month, people booked 21 books, which is the highest of the previous months.
Sample 2: The Chart Below Gives Information About the Number of Books Rented
The graph presents data about the number of books that were rented in a local library in Britain from January to December in the year 2009.
In general, February recorded the lowest number of books rented in the year, and December recorded the highest number of books rented in a British local library in 2009.
The number of books rented at the beginning was 10. This figure saw a sharp decline to 6 books in February. The lowest figure was recorded for the number of books rented in 2009. The number of books rented increased slightly in March to 7 and then appreciated sharply to 13 books rented in April. There were fluctuations in the number of books rented from May to July.
In August, 20 books were rented from the Malton Town library, the second-highest number of books rented in 2009. There was a sharp decline in the number of books rented from 20 books to 12 books in September and fluctuated to 21 in December, the highest number of books rented in the year. From the graph, May and July equal the number of books rented(15 books) while June and October also recorded 14 each.
