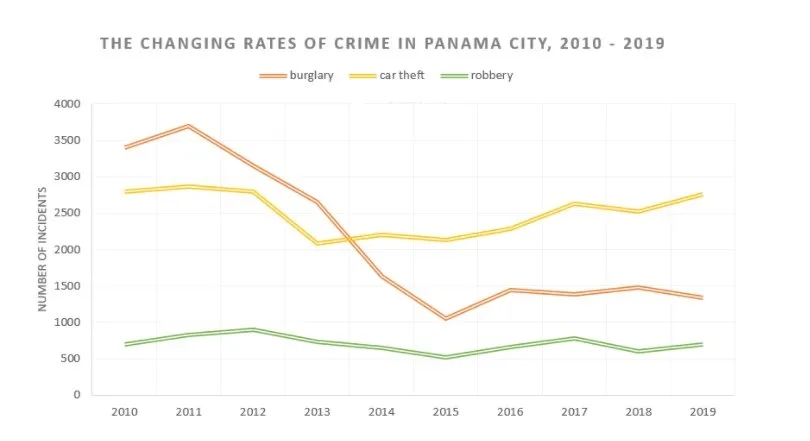
The chart below shows the changes that took place in three different areas of crime in Panama City from 2010 to 2019. Summarise the information by selecting and reporting the main features, and make comparisons where relevant.
The given chart depicts the changes that took place in Panama City from the year 2010 to 2019 in three different areas of crime.
Overall, it could be illustrated that the number of incidents that took place in Panama City saw a decline in the crime of burglary but a parallel shift for both car theft and robbery with variances in the number of incidents from the year 2010 to 2019.
From the chart, it is observed that in the year 2010 the number of incidents recorded for burglary had 3500, but that of car theft and robbery had 2800 and 800 respectively. In the year 2011, the number of incident for burglary slightly increased to 3700 but steadily declined from that point to 1000 in the year 2015. There lines of burglary and car theft emerged between the years of 2013 and 2014 when the number of incidents for car theft had a shift of decline from 2012 to 2013 with a slight raise bringing merged lines. With respect to that of robbery, the number of an incident that took place in Panama City fell under1000 with its peak in the year 2012, which recorded 1000 but that of the subsequent years from 2012 to 2019 had a bit of a decline and a rise recording 700, 600, 500, 700, 800, 600 and 700 respectively.
It could be observed that after the emerged lines of burglary and car theft between the years of 2013 and 2014 saw a steady increase in the number of incidents that took place for car theft, recording 2600 in the year 2019. For that of burglary, it’s gradually rose to 1500 in the year 2016, with a blunt line from 2016 to that of 2018 recording 1500 and finally, a slope in the year 2019 recording 1400 per the number of incidents that took place in Panama City.
Follow Us on IELTSDATA Twitter
Also read: The Map Below Shows a Civic Centre Between The Present and Its Future Plan
