The Chart Below Shows the Percentage of Female Members of Parliament in 5 European Countries from 2000 to 2012. Summarize the Information by Selecting and Reporting the Main Features, and Make Comparisons Where Relevant.
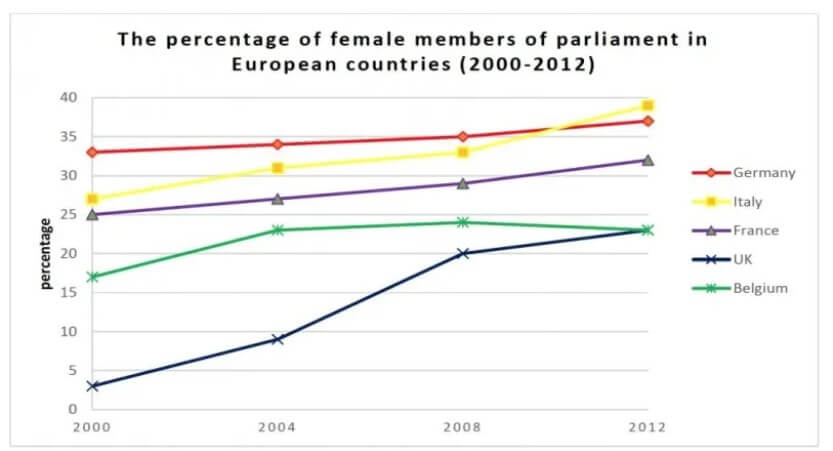
The line graph illustrates the proportion of women members of parliament in five distinct nations, such as Germany, Italy, France, the UK, and Belgium, from 2000 to 2012.
Overall, Italy had the highest number of female members of parliament and the lowest number of females involved in politics in the UK. The UK and Belgium had the same number of female members of parliament in 2012.
Also, Read In Some Countries, More and More Parents Have Begun to Teach Their Children
To begin with, The highest number of female members involved in parliament in Germany in 2000, which was nearly 35%.Moreover, almost 25% of women in parliament in the same year. In Germany, ladies’ numbers steadily increased in the next few years, which was approximately 36%. Nearly A quarter of female members of parliament in both countries Italy and France in 2000.After that, steady rise in the next year.which was almost 27%. In the last years, 30% above ladies have been members of parliament in France. The majority of female members of parliament in Italy in 2012. was nearly 40%.
Furthermore, In 2000, 15% above women members of parliament in Belgium. Additionally, the following year sharply increased in 2004, which is almost 23%. After that, some minor fluctuation in Both the years 2008 and 2012.respectively nearly 24%. In the UK, all years rapidly rise in ladies members of parliament.
Follow Us On IELTSFever Facebook Page For More Updates