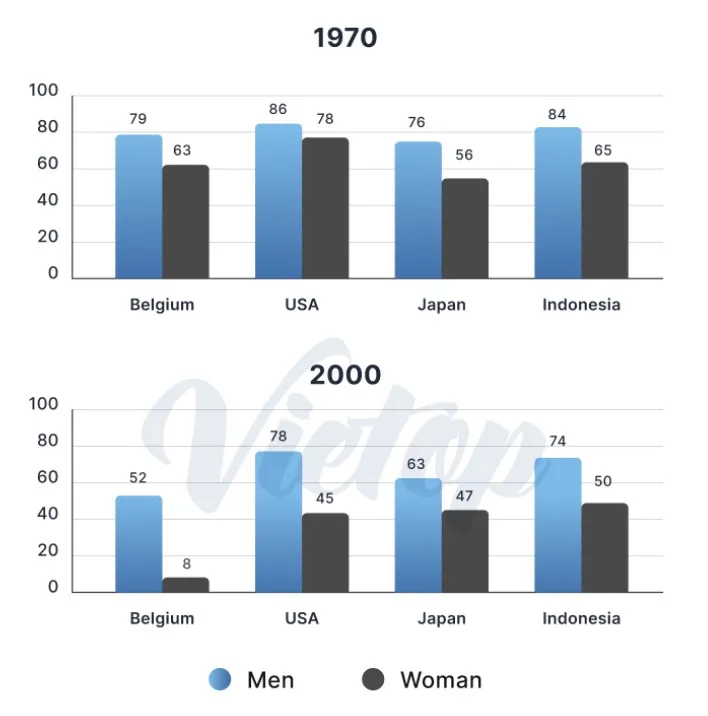
The Chart Show information about the percentage of men and women aged 60-64 who were employed in four countries in 1970 and 2000. Summarize the information by selecting and reporting the main features, and make comparisons where relevant.
The bar chart illustrates the elder people working in the countries named as Belgium, USA, Japan and Indonesia in 1970 and 2000.
Overall, in 1970 all men and women over 60 age were employed in almost all four countries whereas, in 2000 Belgium had the lowest women employees.
In 1970, there is not much downward trend is seen in all four countries. The USA has the highest number of elder people employed over 60 years with 86% and 78%, following Indonesia with 84% and 65% respectively. Moreover, Japan and Belgium have a ratio of (76/ 56% and 79/63%) employees working over 64 aged men to women.
By contrast, it was seen in 2000. Belgium has the lowest women ratio with 8% comparative to men with 52%. Whereas, the USA has also been seen a decrease in the number of women with 45% to men with 78%. Following, Indonesia women with 50% to men with 74%. But, Japan has little fluctuations men with 63% to women with 47%.
Follow Us on IELTSDATA Twitter
