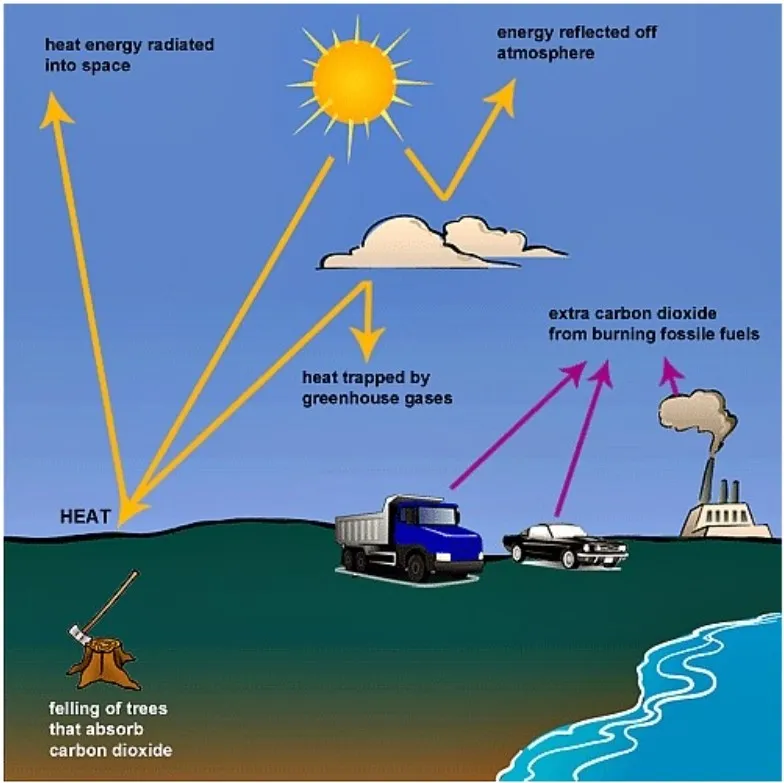
The following diagram shows how greenhouse gases trap energy from the Sun. Write a report for a university lecturer describing the information shown in the diagram. Summarise the information by selecting and reporting the main features and making comparisons where relevant
Sample Answer of The Following Diagram Shows how Greenhouse Gases Trap Energy from The Sun
The information about how greenhouse gases make the atmosphere hot has been depicted by the rendered diagram.
At first glance, the graph Illustrates that the main source of energy is the sun. It produces heat and sends it to each constituent of the earth, then after earth reflects those heat to the space. There are myriad objects on the earth surface that take part in the reduction of greenhouse gases, such as trees and water.
Due to urbanization on pollution forms a cloud containing toxic gases such as carbon monoxide. These clouds resist the reflection of the heat to the space; hence, those gases are known as greenhouse gases. Moreover, the sun proposes heat on the clouds, and clouds reflect the heat energy to the atmosphere.
Follow Us on IELTSDATA Twitter
Also read: The Diagram Details The Process of Making Wool
