The Graph and Table Below Give Information About Worldwide Water Use and Consumption in Two Different Countries. Summarise the Information by Selecting and Reporting the Main Features and Make Comparisons Where Relevant.
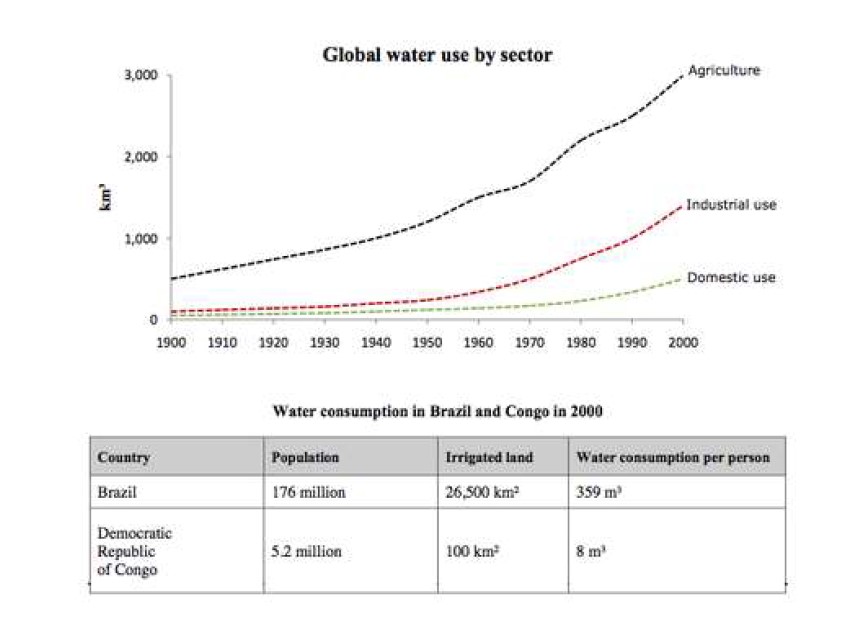
The provided graph and table are pictorial representations of worldwide water use in different sectors, and the table depicts water consumption in two different countries.
Although the image has several pertinent aspects in the global use of water, most water is used in agriculture. Apart from this, the people of country Brazil consumed an excess amount of water in contrast with the masses of the Democratic Republic Of Cargo.
Commencing with water usage, in the year 1900 almost 100km3 of water was used for domestic and industrial purposes respectively. However, approximately 500km3 of water was utilised in the agriculture sector in 1900.
Furthermore, after 100 years, the consumption increased steadily, and 400km3 of water was used for domestic purposes. Whereas, the water usage in the industrial sector reached nearly 1200km3 in 2000. But water usage in the agriculture sector has just doubled compared to the 1900.
Follow Us On IELTSData Facebook Page For More Updates
Analysing the data further, In Brazil, the population of masses was 176 million in 2000, and each consumed 359m3 of water. Apart from this, Brazil had 26500km2 of irrigated land.
Moreover, in the country Democratic Republic of Cargo, the population was only 5.2 million, and it had only 100 km2 of irrigated land. Moreover, only 8m3 of water was consumed per person in 2000.
