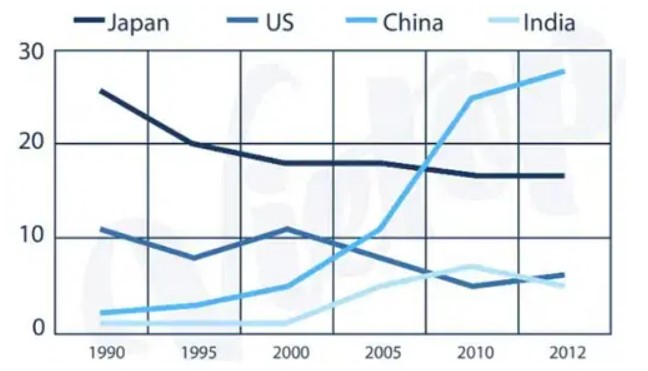
 The graph illustrates the percentage of Azerbaijan’s exports to 4 different nations (JAPAN, USA, CHINA, and INDIA).
Overall, three countries, Japan, the US, and India, all had a rate of exportation as the year progressed, while China’s exportation rate increased rapidly.
Japan and the USA both started around 25% and 11% in the year 1990, respectively, although Japan’s export rate steadily declined over the years and was at almost 18% in 2012; the USA had fluctuations throughout the years but hit its lowest at almost 4% in 2020 then levelled to 5% in 2012.
Both China and India started at around 3% in the year 1990 and minimally increased after five years. In 2000, China’s imports from Azerbaijan skyrocketed to almost 30% in 2012. Meanwhile, India improved gradually from the year 2000 till the end of 2010 at almost 7% before decreasing to around 4% in 2012.
Follow Us On IELTSData Facebook Page For More Updates.