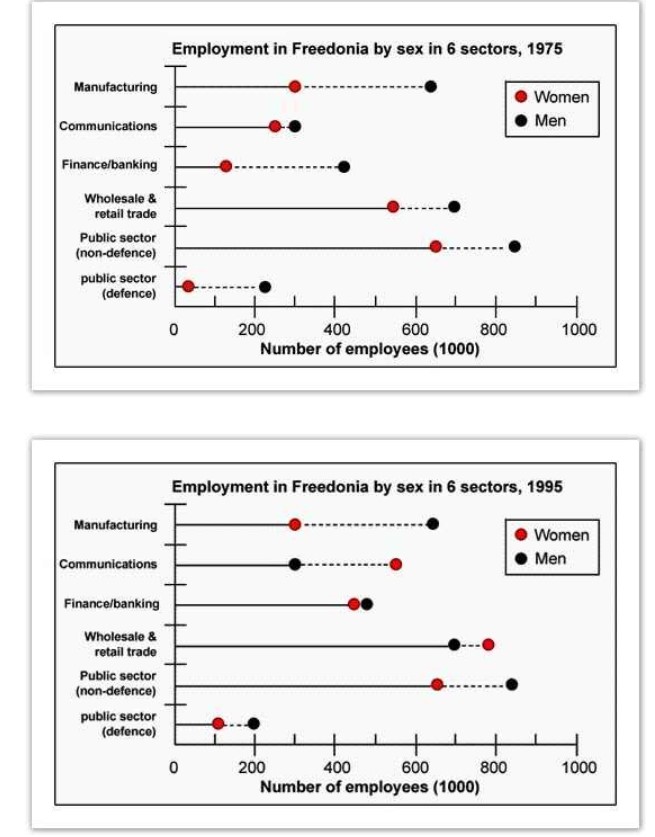
The graphs below show the numbers of male and female workers in 1975 and 1995 in several employment sectors of the Republic of Freedonia. Write a report for a university teacher describing the information shown.
The graph depicts employment in the republic of Freedonia based on gender in six working sectors of 1975 and 1995. Overall, people working on the non-defence of the public sector have the highest number of male and female workers whereas the protection of the public sector has the lowest employees in both years.
In 1975, non-defence public sector highest employees consisted of 850000 men and 650000 women in total. The wholesale and retail sectors consist of the second-highest number of male and female employees of 700000 and 500000 respectively. The finance sector has 400000 male workers where female workers were less than one-third of men. The communication sector has a similar number of both male and female employees, around 300000. However, the manufacturing sector consists of a total 650000 of male workers, where female workers are just as half of the male workers. The public sector related to defence consists of the least number of employees 200000 of men and 50000 women were on jobs.
However, in 1995, the number of women employed increased up to 100000, but the number of male employees remained stable at 200000 on the defence of public sector. In contrast, the non-defence of public sector and manufacturing remained stable in several employees as of the previous year(1975). The number of jobholders in wholesale and retail trade slightly increased where females are leading with 750000 employees and 700000 male employees. The financial and banking sector got a dramatic increase in the number of both genders employees where both male and female have a similar employment rate of 500000. Although in the communication sector female has the highest number of employment by 600000 were male in half of the numbers of female consisting only 300000 employees.
Follow Us on IELTSDATA Twitter
Also Read The Pie Chart Shows the Percentage of Persons Arrested in the Five years
